In This Article
Crypto market cycles is no longer just about Bitcoin halvings and fixed supply shocks; today’s price action moves in liquidity waves shaped by institutions, ETFs, and macro policy.
While Bitcoin’s halving once set a simple, predictable rhythm, today’s market is driven just as much by macro forces like interest rates, ETFs, and institutional capital flows. With monetary policy now influencing price action as much as supply, the real question isn’t when the next bull run starts, but whether the traditional 4-year crypto cycle still exists at all. In this guide, we have discussed the various cycles of the crypto market and examined whether the 4-year pattern still holds.
Key Takeaways
- Crypto market cycles still show strong correlation to Bitcoin’s four-year halving schedule, but macro liquidity now plays an equal, sometimes greater, role.
- Historical data shows Bitcoin tends to bottom 12-18 months after a cycle peak, aligning with miner capitulation and declining trading volume.
- Altcoins continue to follow Bitcoin because liquidity concentration, institutional flows, and risk-adjusted returns still anchor the entire market to BTC.
- Q4 has repeatedly delivered weak performance during tightening cycles due to tax-loss harvesting, reduced liquidity, and macroeconomic stress.
- Determining the current phase requires tracking price action, supply issuance, macro policy, and market sentiment, not assuming the four-year cycle will repeat perfectly.
What Are Crypto Market Cycles?
A crypto market cycle is the repeating sequence of expansion and contraction driven by liquidity, supply issuance, leverage, and investor psychology.
Unlike traditional financial markets, the cryptocurrency market is anchored to a single asset, Bitcoin, the largest cryptocurrency by market value and the only digital asset with a predictable, mathematically enforced supply schedule.

Every cycle begins with one simple fact: new Bitcoin entering circulation declines every four years. That reduction in block rewards disrupts the balance between buyers and sellers. When supply tightens, and demand rises because of institutional investors, ETFs, or speculative mania, you get rising prices. When liquidity dries up, leverage unwinds, and macro turns hostile, the market collapses.
Crypto cycles don’t happen because traders believe in “history repeating.” They happen because the issuance curve forces periodic fluctuations. Miners must sell to survive. Investors chase higher returns during easy-money policies. Short sellers press the market during tightening cycles. All of this creates a rhythm that becomes visible only when you zoom out and study the data, not the narratives.
Phases of a Typical Crypto Cycle
A full cycle moves through four distinct behavioral and structural stages. The accumulation phase begins when prices stabilize at low levels after a capitulation event. Trading volumes dry up, sentiment is dead, and only savvy investors accumulate slowly. This is the quietest part of the cycle, the point where supply is absorbed, and risk is mispriced because the crowd has moved on.
The markup phase starts once demand finally outweighs lingering sell pressure. Prices begin to rise, often gradually at first, then aggressively as liquidity expands. Positive news hits harder. Narratives catch fire. Volume returns. This is where the crowd rediscovers the cryptocurrency market and convinces itself that this time it’s early.

Eventually, the distribution phase begins. Prices are high, liquidity is strong, and market sentiment becomes unhinged. The crowd expects higher prices regardless of fundamentals, while early buyers quietly sell into strength. Investors sell not because they’re bearish but because the market gives them the gift of liquidity. This is the phase fueled by extreme greed, leverage, and unrealistic expectations.
Finally, the markdown phase arrives. Liquidity evaporates quickly. Forced sellers overwhelm the bid. Derivatives unwind. Negative news becomes a self-fulfilling prophecy. Prices fall harder than they rose, punishing anyone who confused momentum for value. Only after leverage clears and pain exhausts itself does the cycle reset, and the accumulation phase quietly begins again.
Why Bitcoin Leads the Entire Crypto Market?
Bitcoin leads because it is the only asset in this ecosystem that behaves like real collateral. Everything else trades as a leveraged bet on Bitcoin’s direction. The market follows BTC not because of ideology, but because of structure: the deepest liquidity, the largest derivatives market, the most predictable monetary policy, and the heaviest institutional flows all center on one asset.
The halving schedule and declining block reward create the only supply shock in modern finance that is both predictable and enforced by code. When Bitcoin entering circulation decreases, structural sell pressure drops.
Miners offload less inventory. Supply thins out. When liquidity rises at the same time, the result is a bull market. When liquidity falls, the same supply dynamics accelerate a bear market. Nothing else in crypto has this kind of deterministic supply curve.

Altcoins follow because they have no monetary anchor. Their liquidity is shallow, their flows depend on Bitcoin’s performance, and their value is marked relative to BTC in most trading pairs. When Bitcoin strength pulls in capital, altcoins rally as traders rotate from the leader into higher-beta bets. When Bitcoin weakens, altcoins implode first because they lack deep order books, institutional support, or macro relevance.
Institutions reinforce this hierarchy. They buy Bitcoin, not the endless list of speculative tokens. They use BTC derivatives for hedging. They allocate through Bitcoin ETFs, not fringe assets. As institutional participation increases, Bitcoin’s role as the market’s gravitational center becomes even stronger.
Cycles start with Bitcoin, end with Bitcoin, and the rest of the market simply amplifies whatever direction it chooses.
Understanding the Bitcoin 4-Year Cycle
Bitcoin’s four-year cycle exists because its monetary policy is fixed, predictable, and indifferent to human emotion. Every 210,000 blocks (roughly every four years), the network cuts the block reward in half. This reduces new Bitcoin entering circulation and compresses structural sell pressure.
The halving schedule creates a repeating supply shock unmatched in modern finance. Miners, who are forced sellers, suddenly receive 50% fewer coins. If demand holds or increases, price action shifts upward because fewer coins are available to absorb buy-side liquidity. This is why the Bitcoin cycle tends to mirror the same arc: bottom, expansion, euphoria, collapse.

The cadence is math. But the effect only works because the crypto market is small relative to global financial markets. When monetary policy loosens, liquidity rushes back into high-beta assets, and Bitcoin’s tight supply becomes rocket fuel. When monetary policy tightens, demand falls, miners struggle, and the market sinks back into its accumulation phase.
This is why the four-year cycle still shows up in charts: Supply is fixed. Liquidity is not. The intersection of those two variables creates the cycle.
How BTC Halving Events Influence Crypto Market Cycles?
A halving creates immediate disequilibrium. Before the halving, miners sell a steady stream of coins to cover operating costs. After the halving, that stream is cut in half, reducing the amount of BTC that must be sold on the open market.
Historically, the market needs several months to absorb the new supply dynamics. During this adjustment period, prices stabilize, volatility compresses, and the market forms a base. Once demand outpaces reduced supply, prices begin to rise, signaling the start of the markup phase.
Halvings don’t cause bull markets by themselves; liquidity is the fuel, but they change the structure of the market enough that any increase in demand leads to disproportionate upside. That’s why the halving remains a key part of every crypto bull market cycle and why long-term holders treat it as the ultimate buying opportunity.
Reduced issuance doesn’t guarantee higher prices, but it makes those prices easier to achieve when global liquidity rebounds.
Historical Bitcoin Halvings & Market Reactions
The chart below tells the real story. Every halving has produced the same structural outcome: a sharp reduction in sell pressure followed by an aggressive repricing of Bitcoin once liquidity returns. But the magnitude of each cycle reflects the maturity of the market and the flow of capital available at the time.
Halving 1 (2012)
The first halving cut block rewards from 50 to 25 BTC. With almost no institutional presence and tiny global liquidity, even a modest shift in demand sent Bitcoin vertical. +416% in the year leading up to the halving. +7,715% in the year after. This was the birth of a new asset meeting a supply schedule the market didn’t understand yet.
Halving 2 (2016)
The reward dropped again, this time to 12.5 BTC. Supply shock met the first wave of mainstream attention. +110% in the year before. +283% in the year after, later extending into another +672% run
The market started to behave like a real, reflexive system. Speculators realized that the halving wasn’t a marketing event; it was a structural one.

Halving 3 (2020)
Bitcoin entered the third halving with deeper liquidity, early institutional inflows, and the most accommodative monetary regime in modern history. +76% before the halving. +423% after. Stimulus checks, ZIRP, and unprecedented balance sheet expansion turned Bitcoin into a macro asset overnight.
Halving 4 (2024)
The latest halving cut issuance to 3.125 BTC per block. But unlike prior cycles, the supply shock collided with rising interest rates, reduced liquidity, and delayed retail participation. Even then, the pattern persisted: 50% run-up into the halving. Early projections show a potential 200%+ expansion if liquidity normalizes.
The difference now is the presence of Bitcoin ETFs, which have transformed BTC from a retail-driven asset into an institutional carry trade with regulated inflows. That changes the speed of the cycle, not the mechanics.
Across all four halvings, one fact holds: When supply drops, and liquidity rises, the market doesn’t just move, it reprices violently. The chart is the visual proof. The numbers aren’t narrative. They’re math, miners, issuance, and liquidity colliding every four years.
Why Most Altcoins Follow Bitcoin’s Price Trend?
Altcoins behave like leveraged derivatives of Bitcoin because their markets lack structural depth. BTC sets the tone because it absorbs the majority of global trading volume, derivatives open interest, and institutional inflows. When Bitcoin moves, everything else either exaggerates that move or collapses under it.
Most altcoins lack predictable supply schedules, robust monetary policies, or significant institutional demand. Their liquidity depends on traders rotating capital after Bitcoin rallies. When BTC enters markup, altcoins follow because traders chase higher returns in smaller assets. When BTC enters markdown, altcoins implode faster because buyers vanish and order books thin out.
Bitcoin dictates the crypto market cycle because:
Altcoins don’t lead cycles; they react. The entire cryptocurrency market is a mirror reflecting Bitcoin’s trend, magnified through volatility and speculation.
Why Q4 Hasn’t Been Good for Crypto?
Q4 has historically been a battleground for liquidity, and 2025 followed the script. Bitcoin entered the quarter fighting a macro backdrop that punished every risk asset: elevated interest rates, sticky inflation, shrinking global liquidity, and a stronger dollar. Add in ETF outflow slowdowns, miner compression post-halving, and exhausted retail momentum, and the result is mechanical, not emotional.
Crypto doesn’t suffer in Q4 because of “seasonality.” It suffers because liquidity tightens into year-end across financial markets. Funds deleverage. Hedge funds unwind. Investors lock in gains. Tax-loss harvesting pressures weaker assets. In a market built on reflexivity, even small liquidity contractions cascade.
In 2025, that pressure collided with a market already fatigued from post-halving consolidation. Instead of a clean markup phase, Bitcoin ran into macro headwinds and crypto, being the highest-beta corner of global markets, absorbed the hit instantly.
Historical Q4 Performance of Bitcoin & Altcoins
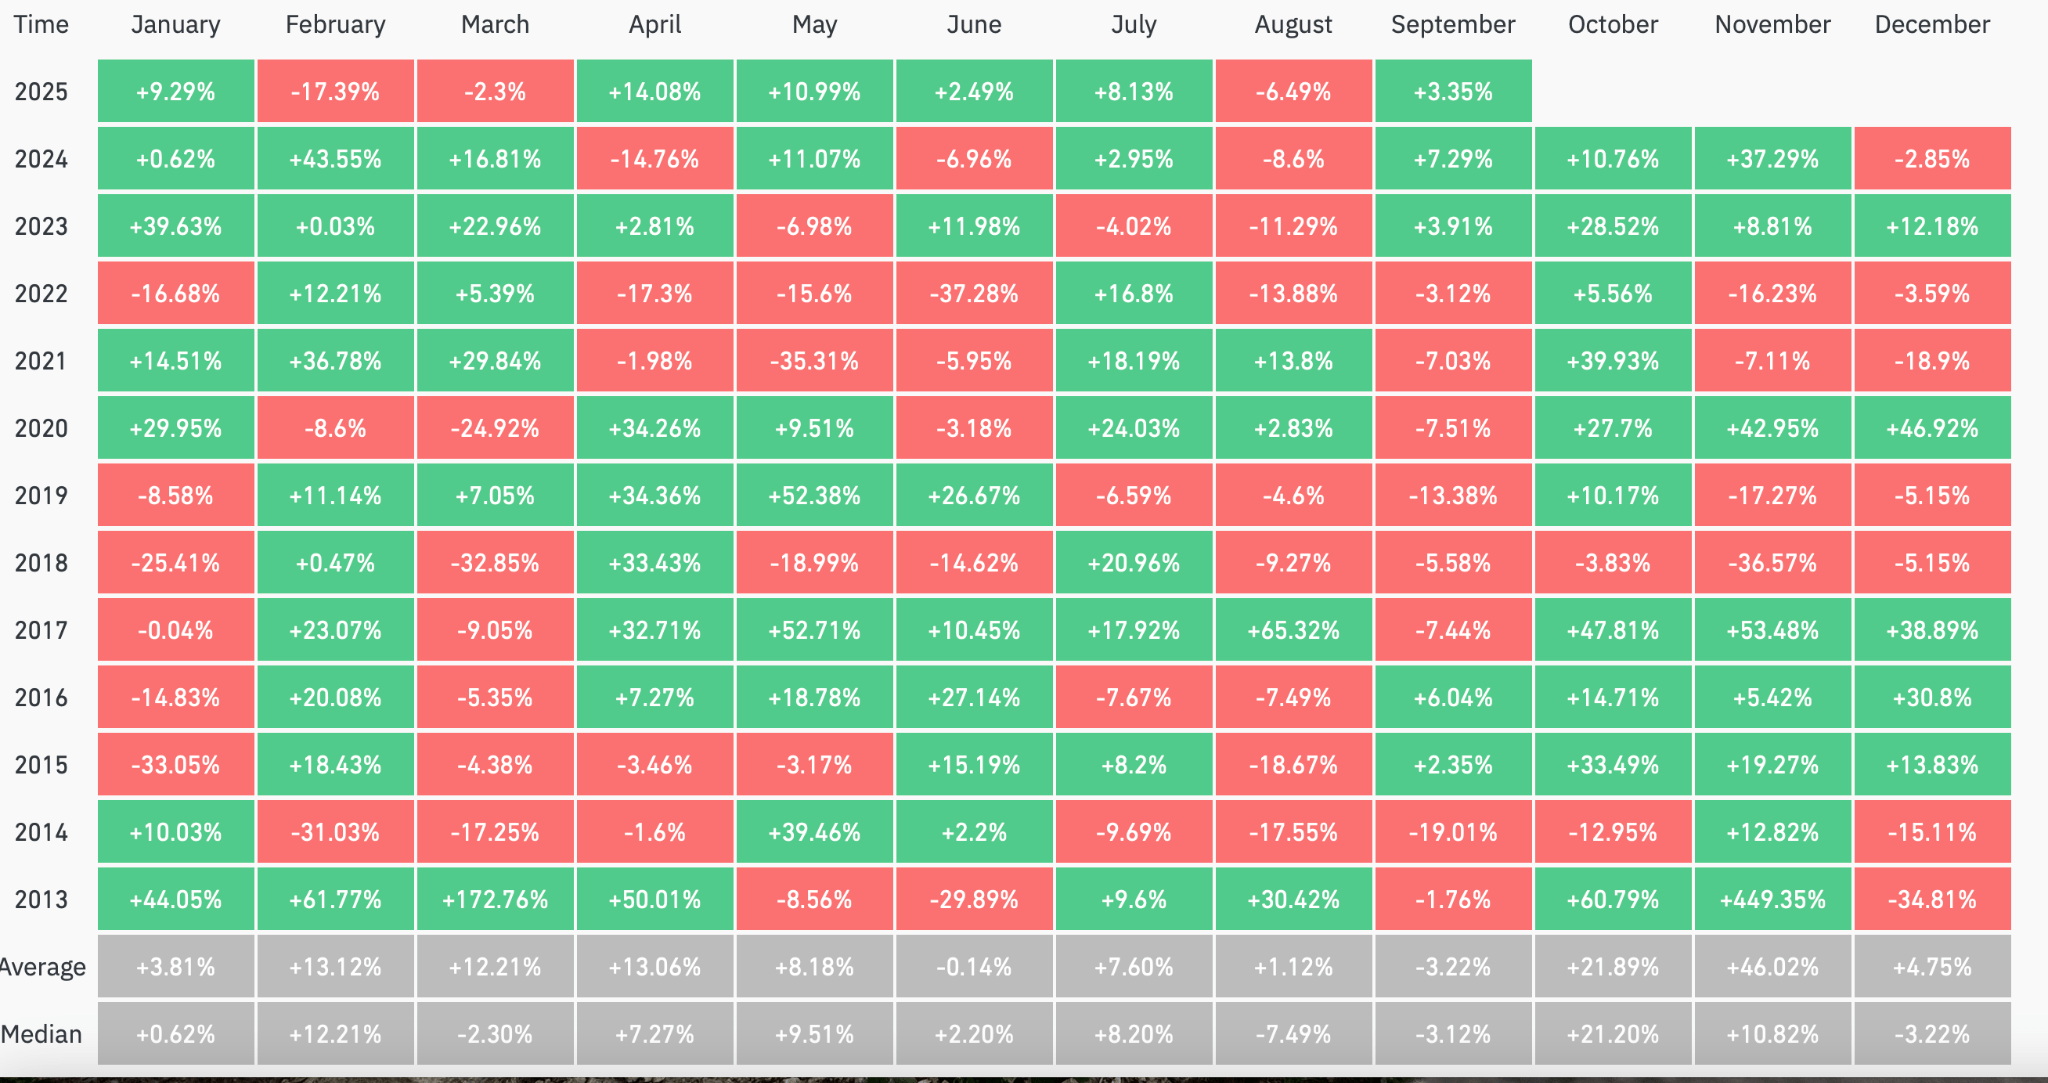
The chart below makes one thing clear: Q4 is binary. When liquidity is abundant, Bitcoin explodes higher. When liquidity tightens, the market bleeds out. There is no middle ground.
Across 2013-2025, Q4 follows a consistent pattern that mirrors global liquidity conditions:
Strong Q4 Years (Liquidity Expanding)
In these years, Bitcoin has behaved exactly like a high-beta liquidity sponge. When global money flows increase, BTC absorbs the wave first, dragging altcoins higher in a delayed echo.
Weak Q4 Years (Liquidity Contracting)
These years share the same fingerprints: rising rates, a stronger dollar, and risk aversion across global financial markets. When Bitcoin cracks in Q4, altcoins don’t correct; they disintegrate due to thin liquidity and forced selling.
According to the chart:
But averages lie. Crypto doesn’t do “normal.” Q4 tends to be either exceptionally strong or aggressively negative, a reflection of liquidity expansion or contraction. Altcoins track the same pattern, but with a higher beta. When Bitcoin posts +40%, altcoins post +100-300%. When Bitcoin drops -15%, altcoins drop -40-70%.
Macroeconomic Factors Affecting Crypto in Q4
Q4 sits at the intersection of multiple macro forces that hit crypto harder than traditional assets.
- Global Liquidity Drain: Central banks reducing their balance sheets pull cash out of the global financial system. Less dollar liquidity means less capital available for speculative assets like crypto. Bitcoin and altcoins tend to fall first when liquidity tightens.
- Higher Funding Stress: Money markets tighten in Q4. Regulatory capital requirements push institutions to hold safer assets. Less speculative capital flows toward crypto prices, trading volume declines, and volatility becomes reflexive.
- Tax-Loss Harvesting: Investors sell underperforming tokens to lock in losses. This is devastating for altcoins in weak years because order books are thin and bid depth evaporates.
- Elevated Dollar Strength: A stronger USD pulls liquidity out of global risk assets. Bitcoin historically underperforms during strong dollar regimes, and altcoins magnify this effect.
None of these dynamics is new. What changed is that crypto is now large enough that macro hits matter instantly, and Q4 tends to cluster all the hits at once.
Is the 4-Year Crypto Cycle Broken?
This is the argument dominating the crypto community. Bitcoin ETFs changed inflows. Institutions now dominate marginal liquidity. Macro policy swings faster than ever. And the market is far larger than in the 2012-2020 era.
So the question is real: Is the four-year cycle still the backbone of crypto, or is it a relic of a smaller market? From a distance, the curve still looks familiar: accumulation, markup, distribution, and markdown. But the cadence is noisier. The timing is less clean. Liquidity shocks distort short-term price action. And the post-2024 environment looks nothing like earlier cycles.
Whether the cycle is broken depends on how you define it: Is it the exact timing that matters? Or the structural logic behind it? Because the issuance schedule hasn’t changed. The liquidity, however, has.
Arguments That the 4-Year Cycle Is Still Alive
Despite all the noise, several data points support the idea that the cycle is intact:
The cycle isn’t dead. It’s just constrained by macro and accelerated by institutional flows.
Reasons Why the Traditional Crypto Cycle May Be Failing
But the counterarguments are real and backed by data:
The truth sits between the extremes. The halving still matters, but it no longer dictates the entire cycle. Liquidity does.
Are We in a Bear Market?
The question matters because identifying the crypto market cycle’s current phase determines whether you hunt for buying opportunities or prepare for forced liquidations. The problem is that crypto never announces when it shifts regimes. By the time retail realizes it’s a bear market, the markdown is half over. And by the time sentiment turns euphoric, the markup phase is already pricing in the next exit liquidity event.
The market right now behaves like an asset stuck between two realities: slowing momentum from the post-halving expansion and macro tightening that continues to drag down market sentiment. It’s not a clean bear market, but it’s not a bull run either. It’s the most dangerous phase, ambiguity, where seasoned traders reduce risk and amateurs increase it.
What Defines a Crypto Bear Market?
A crypto bear market is a mechanical regime where liquidity contracts, sellers dominate, and prices make lower highs and lower lows across multiple timeframes. It begins when:
A bear market is the markdown phase dressed in macro clothing, a period where faith-based valuations collide with liquidity starvation. It is not defined by emotion; it is defined by the absence of sustainable buy-side demand.
Key Signs of a Bitcoin Bear Market
Bitcoin signals its bear markets early through structural indicators:
Bear markets aren’t about fear, they’re about liquidity retreating faster than new buyers can replace it.
Current Market Indicators: Bull, Bear, or Sideways?
Based on structural signals, the market sits in a sideways-to-bearish regime:
This isn’t a classic bear market, but it’s not a markup phase either. It’s the distribution-to-accumulation transition zone, where the market bleeds slowly until macro shifts or an external catalyst provide fresh liquidity.
In simple terms: We’re not crashing, but we’re not growing. We’re waiting, and waiting is its own form of pain.
Crypto Market Cycles vs. Traditional Financial Market Cycles
Crypto cycles move faster because crypto trades on reflexivity, leverage, and narrative. Traditional assets move on cash flow, earnings, and discounted expectations. Crypto is a liquidity vacuum; equities are a cash-flow machine. One reacts instantly; the other digests information over quarters.
The result is structural divergence: Crypto cycles are shorter, sharper, and more dependent on macroeconomic factors like monetary policy, dollar liquidity, and risk appetite. Traditional markets grind; crypto snaps.
Here’s the high-level comparison:
| Aspect | Crypto Market Cycle | Traditional Financial Market Cycle |
|---|---|---|
| Primary Driver | Liquidity + supply issuance (Bitcoin halving) | Earnings, GDP growth, monetary policy |
| Cycle Duration | 4 years (historically) | 7-10 years |
| Volatility | Extremely high; reflexive | Moderate; slower structural changes |
| Catalysts | Halvings, regulation, ETFs, leverage | Interest rates, earnings cycles, inflation |
| Market Participants | Retail + institutions + global traders | Institutional dominance |
| Downside Behavior | Fast, violent markdowns | Slow declines, gradual repricing |
| Psychology | Fear of missing and panic dominate | More rational, diversified positioning |
Will 2026 Be Bullish for Crypto?
If the crypto market cycle predictions 2026 narrative feels conflicted, it’s because the market is caught between two competing forces: tightening monetary policy today and a structurally bullish supply schedule heading into tomorrow.
Traders are questioning whether Bitcoin’s dominance is still intact. Do note, Bitcoin’s issuance was cut in half in 2024. Historically, the second year after a halving (Year +2) delivers the strongest upside as supply compression collides with improving liquidity.

But 2026 doesn’t depend on the halving alone. It depends on whether the Fed and global central banks decide they’ve inflicted enough economic damage. If interest rates fall, liquidity expands, and the dollar softens, crypto becomes the highest-beta trade in global markets again. If macro refuses to ease, Bitcoin can still rise, but the broader cryptocurrency market will drag.
2026 is not about hopium. It’s about structural math:
If liquidity turns even slightly positive, that combination can produce a true bull market. If liquidity stays constrained, the cycle still exists, just flatter, slower, and more selective.
2026 isn’t guaranteed to be bullish. But it is the year when the supply curve and macro curve have the highest probability of aligning. And alignment is what turns accumulation into markup.
Conclusion
Crypto cycles are not random. They are engineered by Bitcoin’s issuance, amplified by global liquidity, and distorted by human psychology. The halving determines supply. Macro determines demand. The market sits in the space between the two, whipsawing traders who mistake volatility for direction.
The crypto market cycle still moves through accumulation, markup, distribution, and markdown, but the timing is no longer clean. The presence of ETFs, institutional flows, and faster macro rotations has stretched parts of the cycle and compressed others. Bitcoin still leads. Altcoins still amplify. Liquidity still decides everything. Is the four-year cycle intact? Mechanically, yes. Behaviorally, inconsistent. Structurally: evolving.
2026 has the ingredients for a bullish phase with reduced issuance, broader adoption, and deeper liquidity rails, but it needs macro cooperation. If liquidity expands, the next bull run will look less like 2020 and more like a refined, institutionally driven replay. If macro stays tight, the cycle will still turn just more slowly, with lower beta, and with fewer survivors.
Crypto isn’t dead, broken, or unpredictable. It’s just a mirror of global liquidity, priced in real time. The traders who understand that don’t fear the cycle. They front-run it.
See Also:
- Crypto Market 2025: Year-End Review & Expert Insights
- What is DeFAI? A Beginner’s Guide
- Crypto Exchange Promos & Discounts
- Crypto Wallet Promos & Discounts
- What is a Perp DEX? Perpetuals Explained
- Top Perpetual Decentralized Exchanges in 2026
- Top Prediction Markets in June 2026
FAQs
Why hasn’t Q4 been good for crypto in 2025?

Because liquidity tightened at the exact moment global risk appetite fell. Year-end deleveraging, tax-loss harvesting, and high interest rates drained capital from the crypto market, hitting altcoins the hardest.
Is the Bitcoin halving the only driver of crypto cycles?
No. The halving shapes supply, but liquidity, interest rates, ETF flows, and macro conditions determine demand. Cycles form at the intersection of both forces.
Will crypto be bullish again in 2026?
If global liquidity improves, 2026 has strong odds of becoming a bullish year because issuance is lower and institutional flows are deeper. Without macro support, the upside will be slower and more selective.
Is the 4-year crypto cycle dead?
No, but it’s less clean. Supply shocks still matter, but macro now dictates timing, volatility, and magnitude more than in earlier cycles.
How long do crypto bear markets usually last?
Historically, 12-18 months from peak to bottom, with extended sideways periods afterwards. The exact length depends on liquidity conditions and miner stress.
Should I invest in crypto during a bear market?
Bear markets are where long-term positions are built, but only for investors with discipline and a time horizon. Without a plan or risk management, they can be the most punishing phase of the cycle.
References
- “An Empirical Examination of Bitcoin’s Halving Effects: Assessing Cryptocurrency Sustainability within the Landscape of Financial Technologies.” ResearchGate, 2024, https://www.researchgate.net/publication/380980325_An_Empirical_Examination_of_Bitcoin’s_Halving_Effects_Assessing_Cryptocurrency_Sustainability_within_the_Landscape_of_Financial_Technologies
- Cain, Cody M. “Bitcoin Halving: What to Know about the Cryptocurrency’s Scheduled Supply Cut.” Northeastern Global News, 18 Apr. 2024, https://news.northeastern.edu/2024/04/18/bitcoin-halving/
- Sickinger, Ted. “Is Another Bitcoin Rally Coming? Halving Could Make Mining More Difficult — but Also More Lucrative.” OPB, 16 Apr. 2024, https://www.opb.org/article/2024/04/16/bitcoin-halving-rally-energy/
- “Bitcoin Halving: The Ultimate Countdown Guide.” Blockchain Council, 2024, https://www.blockchain-council.org/cryptocurrency/the-ultimate-bitcoin-halving-countdown-guide-everything-you-need-to-know/
- “Next Bitcoin Halving Dates.” BitDegree, 2024, https://www.bitdegree.org/halving/next-bitcoin-halving-dates
Why you can trust 99Bitcoins
Established in 2013, 99Bitcoin’s team members have been crypto experts since Bitcoin’s Early days.
Weekly Research
100k+Monthly readers
Expert contributors
2000+Crypto Projects Reviewed