
The ADX indicator is a technical analysis trading tool developed in the 1970s by J. Welles Wilder. This indicator has proven to be one of the most useful and popular trading tools over the decades. This article will help you understand what the ADX indicator is and how it can help you when trading stocks and crypto.
ADX Indicator: Summary
The Average Directional Index (ADX) is a technical analysis indicator developed by J. Welles Wilder to measure the strength of a trend, regardless of its direction. It oscillates between 0 and 100, with higher values indicating stronger trends. Traders use the ADX to:
- Determine if the market is trending or ranging.
- Confirm the strength of ongoing trends.
- Identify potential entry and exit points.
- Use in conjunction as a confirmation tool alongside other indicators.
ADX Pros and Cons
- Helps traders measure the strength of a trend
- Identifies if a market is trending or ranging
- Can be used across multiple assets and time frames
- Works well as a confirmation tool
- Aids in risk management decisions
- Is a lagging indicator
- Limited directional information
- Prone to false signals
- Does not offer a prediction as to power, future movements, or trend duration
- Limited usefulness in range-bound or sideways markets
ADX Key Takeaways:
- Non-directional measurement of trend strength helps traders identify the strength of a trend, both to the upside and downside.
- Typically displayed with two additional lines: +DI (positive directional indicator) and -DI (negative directional indicator).
- Values below 20 suggest a weak or absent trend.
- Values between 20 and 40 indicate a developing or moderate trend.
- Values above 40 signal a strong trend.
What is the ADX Indicator?
The Average Directional Index indicator, more commonly referred to as the ADX, is a popular technical analysis tool used by traders across all asset classes and time frames.
The ADX measures the strength, but not the direction of a trend. This helps traders identify early if a trend is slowing in momentum, perhaps signaling an opportunity to close a position, or identify if a trend is picking up momentum to the upside or downside, signaling a potential opportunity to go long or short.
The indicator ranges between 0 and 100, with values below 20 indicating a weak or no trend, 20-40 indicating a developing or moderate trend, and a signal above 40 showing a strong trend.
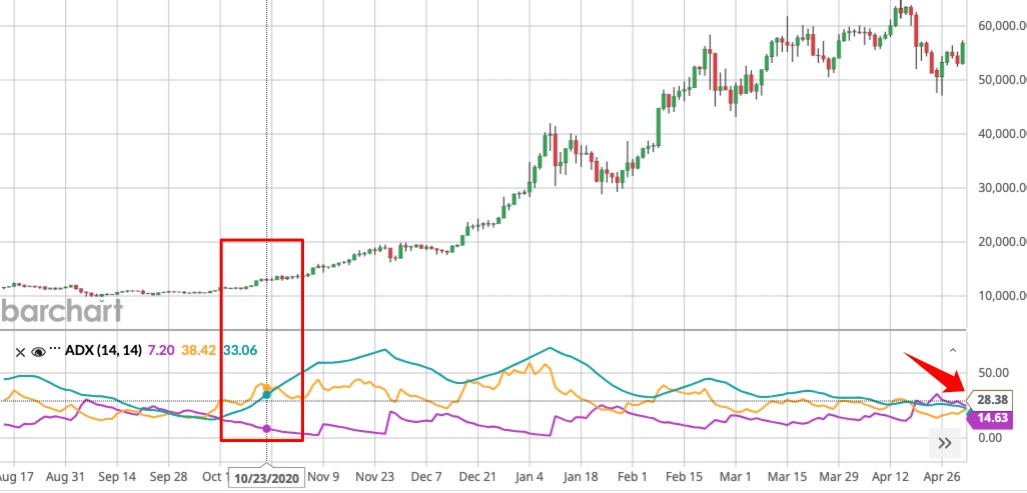
Below we can see an example of the ADX showing an increase as the strength of an uptrend and downtrend increases.
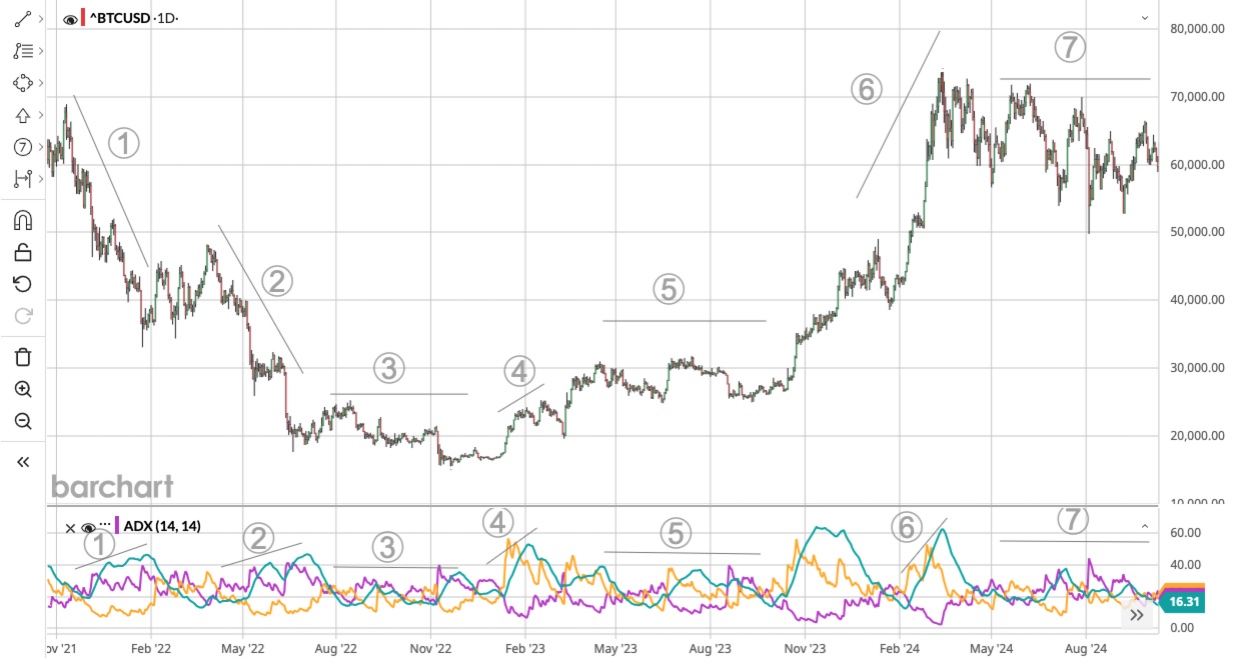
In the above chart, we can see that the ADX accurately shows an increasing strength in a downtrend for #1 and #2. Remember that the ADX is non-directional, so an increase in the ADX can show a strengthening downtrend. A trader could use the ADX here to see an increase in the trend strength and choose to open a short position. Additionally, once the ADX starts to slope down, a trader could choose to close their position as the strength of the trend is slowing down.
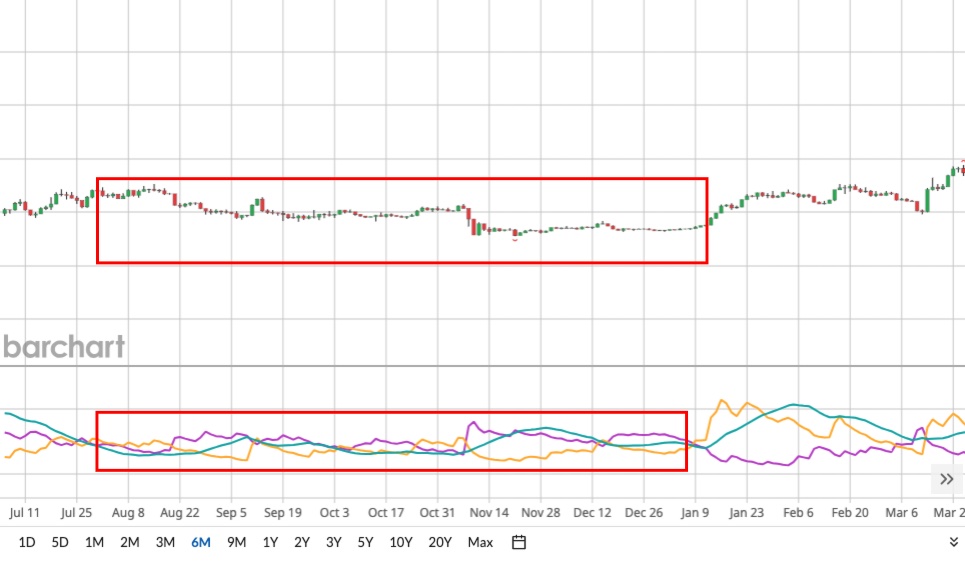
The ADX is also good at identifying sideways or range-bound markets, which are statistically where traders lose most of their trades. Looking at #3, #5, and #7 on the chart shows a sideways ADX and a number below 40, showing weak or no trend.
#6 shows the ADX accurately identified a strong uptrend forming.
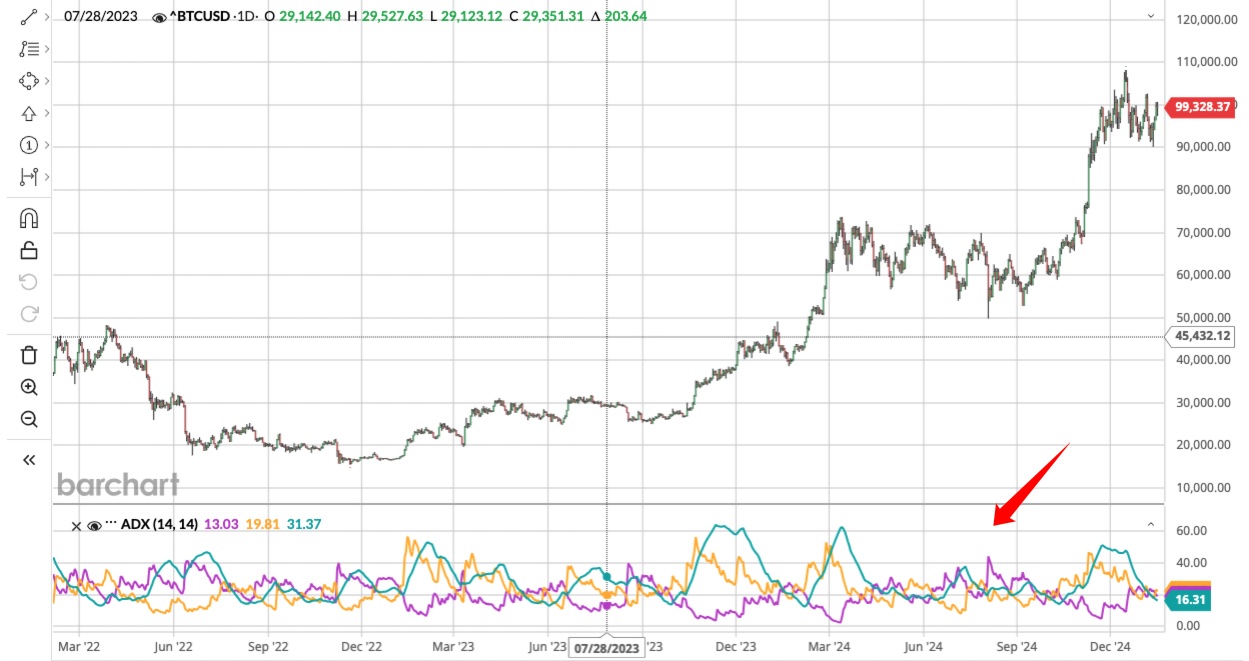
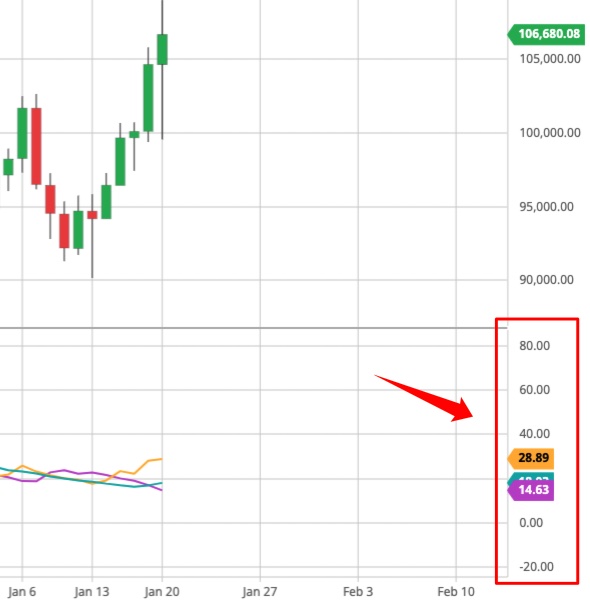
However, as is the case with all indicators, the ADX has its limitations and is prone to false signals. Below you will find such instances.
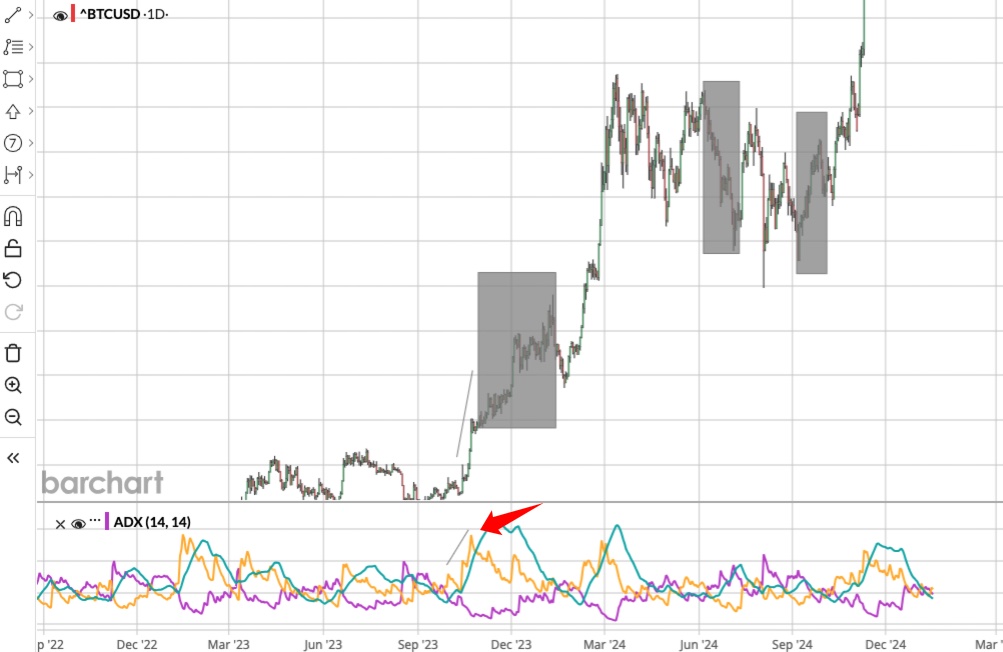
If a trader was using the ADX to close a position, the red arrow indicates the ADX showing a slowdown of a trend on both the green and yellow lines, yet the candlestick chart shows that price continued on a very strong uptrend for a number of days. The other two grey boxes on the right show periods where the ADX remained below 40 yet price had dramatic moves to the downside and upside, a trader relying purely on the ADX would have missed these price movements, so it is important to use the ADX in confluence with other indicators and data points.
History of the ADX
J Welles Wilder Jr. is considered one of the pioneers of technical analysis indicators, known for creating the Directional Movement Index (DMI), the Relative Strength Index (RSI), the Average True Range (ATR) indicator, the Parabolic SAR, as well as the Average Directional Index (ADX).
Wilder, a mechanical engineer turned commodities trader, created the ADX in 1978 to address a critical need in the trading community: a reliable method to measure trend strength regardless of price direction. This innovative indicator quickly gained popularity among commodity traders, who found it particularly useful for navigating the volatile futures markets. Over time, the ADX’s application expanded beyond commodities, becoming a staple tool for traders across various financial markets, including stocks, forex, and cryptocurrencies.
Understanding ADX Values
ADX values provide insights into trend strength, with readings below 20 indicating weak trends or ranging markets, 20-25 suggesting emerging trends, 25-50 signaling strong trends, and above 50 pointing to very strong trends. Extremely strong trends are indicated by ADX readings above 70.
These value ranges help traders distinguish between trending and non-trending market conditions, enabling more informed decision-making in various trading scenarios
How to Use The ADX
Traders can leverage several key strategies to maximize the effectiveness of the Average Directional Index:
Trend Strength Confirmation: Use ADX readings above 25 to confirm tradeable trends before entering positions.
Range-Bound vs. Trending Market Identification: ADX below 20 indicates sideways markets, while values above 25 signal potential trend formation. Range-bound, AKA, Sideways markets are where the majority of traders experience losses.
Entry and Exit Signals: Consider entering trades when ADX rises above 25, and exiting when it drops below 50 to lock in profits.
Combining with Directional Indicators: Look for bullish signals when +DI crosses above -DI with ADX above 25, and bearish signals when -DI crosses above +DI with ADX above 25.
Breakout Confirmation: Validate price breakouts with a rising ADX above 25 to ensure the strength of the move.
These strategies provide a solid foundation for incorporating ADX into various trading approaches across different markets and timeframes.
Conclusion
The ADX Indicator is an important and popular tool for technical analysis. It measures the strength of trends along with the absence of trends to help traders make informed decisions on when to enter or exit a trade.
With values ranging between 0 and 100 to determine the strength of the trend, this non-directional indicator has become a stable in the toolboxes of many traditional and crypto traders.
See Also:
FAQs
What does the ADX indicator measure and how can it be used?

The Average Directional Index (ADX) is a technical indicator that measures the strength of a trend. It ranges between 0 and 100, with higher values indicating stronger trends. The ADX helps traders determine the trend intensity, which is essential for the development of effective trading strategies.
What calculation methods are the basis of the ADX?
The ADX is calculated using the Directional Movement Index (DMI), which consists of two lines: +DI and -DI. These lines are based on the highest and lowest prices in recent days. The ADX itself is determined by smoothing the difference between +DI and -DI, which indicates the trend strength regardless of the trend direction.
Which ADX values are an indicator of strong trends?
An ADX value above 25 often signals a strong and tradable trend. Values between 25 and 50 are ideal for trend tracking strategies. A value between 50 and 75 shows a very strong trend, while values over 75 indicate an extremely strong trend. A value below 20 indicates a weak or nonexistent trend.
How can the ADX indicator be integrated into trading strategies?
The ADX can be used to assess the trend strength and to decide whether a trend follow-up or a sideways market strategy should be used. With high ADX values above 25, traders can continue the trend, while values below 20 indicate that alternative indicators or strategies such as the RSI or Parabolic SAR should be used.
References:
“ADX Indicator.” FBS, https://fbs.eu/en/analytics/guidebooks/adx-indicator-45.
“Average Directional Movement Index.” Wikipedia, https://en.wikipedia.org/wiki/Average_directional_movement_index.
Why you can trust 99Bitcoins
Established in 2013, 99Bitcoin’s team members have been crypto experts since Bitcoin’s Early days.
Weekly Research
100k+Monthly readers
Expert contributors
2000+Crypto Projects Reviewed