
In This Article
- Bitcoin Price Prediction for 2026-2030
- Bitcoin Price Prediction for 2026
- Bitcoin Price Prediction for 2030
- Long-Term Bitcoin Price Forecast for 2040
- Methodologies Used in Our Bitcoin Price Predictions
- What Is Bitcoin and What Is It Used For?
- 2024 Bitcoin Halving
- Is Bitcoin a Buy Right Now?
- Bitcoin Price Prediction: Conclusion
Bitcoin has once again captured global attention. After hitting a new all-time high of around $126,000 in early October 2025, BTC has since pulled back and is currently trading in the high-$80,000 to low-$90,000 range, frequently testing the $95,000 mark from below. This has many investors wondering where Bitcoin will go next. With long-term annualized returns still far outpacing traditional markets, Bitcoin has firmly cemented itself as one of the best-performing assets in modern history.
As the market moves into a new phase of institutional adoption and post-halving momentum, it’s essential to have a solid plan and realistic expectations for Bitcoin’s future trading. In this guide, we will look at expert predictions, on-chain trends, and other factors influencing Bitcoin’s future, including our in-depth price forecasts for 2026 through 2030.
Rising Crypto- Editor’s Choice
- New Bitcoin L2 presale offering massive staking rewards
- By using a SVM Bitcoin Hyper is revolutionizing Bitcoin's potential
- Early buyers can use $HYPER tokens for transactions, staking, and ecosystem governance
 Bank Card
 BNB
BNB ETH
ETH- +1 more
Bitcoin Price Prediction for 2026-2030
-
-
 Bitcoin
0.51%
Bitcoin
BTC
Price
$64,770.20
0.51% /24h
Volume in 24h
$19.98B
Price 7d
Buy Now!
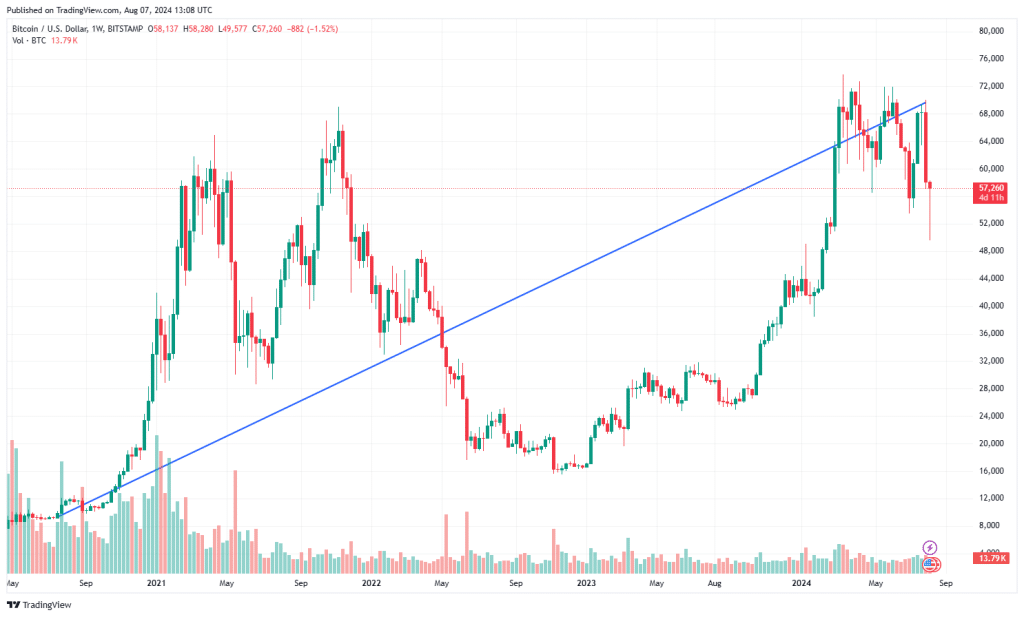
briefly fell below $40,000 in late January of 2024 after spot BTC ETFs were approved in the U.S. However, the coin has rallied since then, reaching a new all-time high of
in 2024.
Bitcoin
0.51%
Bitcoin
BTC
Price
$64,770.20
0.51% /24h
Volume in 24h
$19.98B
Price 7d
Buy Now!
briefly fell below $40,000 in late January of 2024 after spot BTC ETFs were approved in the U.S. However, the coin has rallied since then, reaching a new all-time high of
in 2024.
-
Our earlier forecast that Bitcoin would challenge $100,000 proved directionally accurate, but the timing shifted slightly into December 2024. During 2025 Bitcoin spent much of the year oscillating between $80,000 and $110,000, with a blow-off top near $126,000 before the most recent correction.
| Year | Minimum Price | Average Price | Maximum Price |
| 2026 | $60,000 | $105,000 | $150,000 |
| 2027 | $70,000 | $115,000 | $200,000 |
| 2028 | $85,000 | $120,000 | $200,000 |
| 2030 | $140,000 | $185,000 | $400,000 |
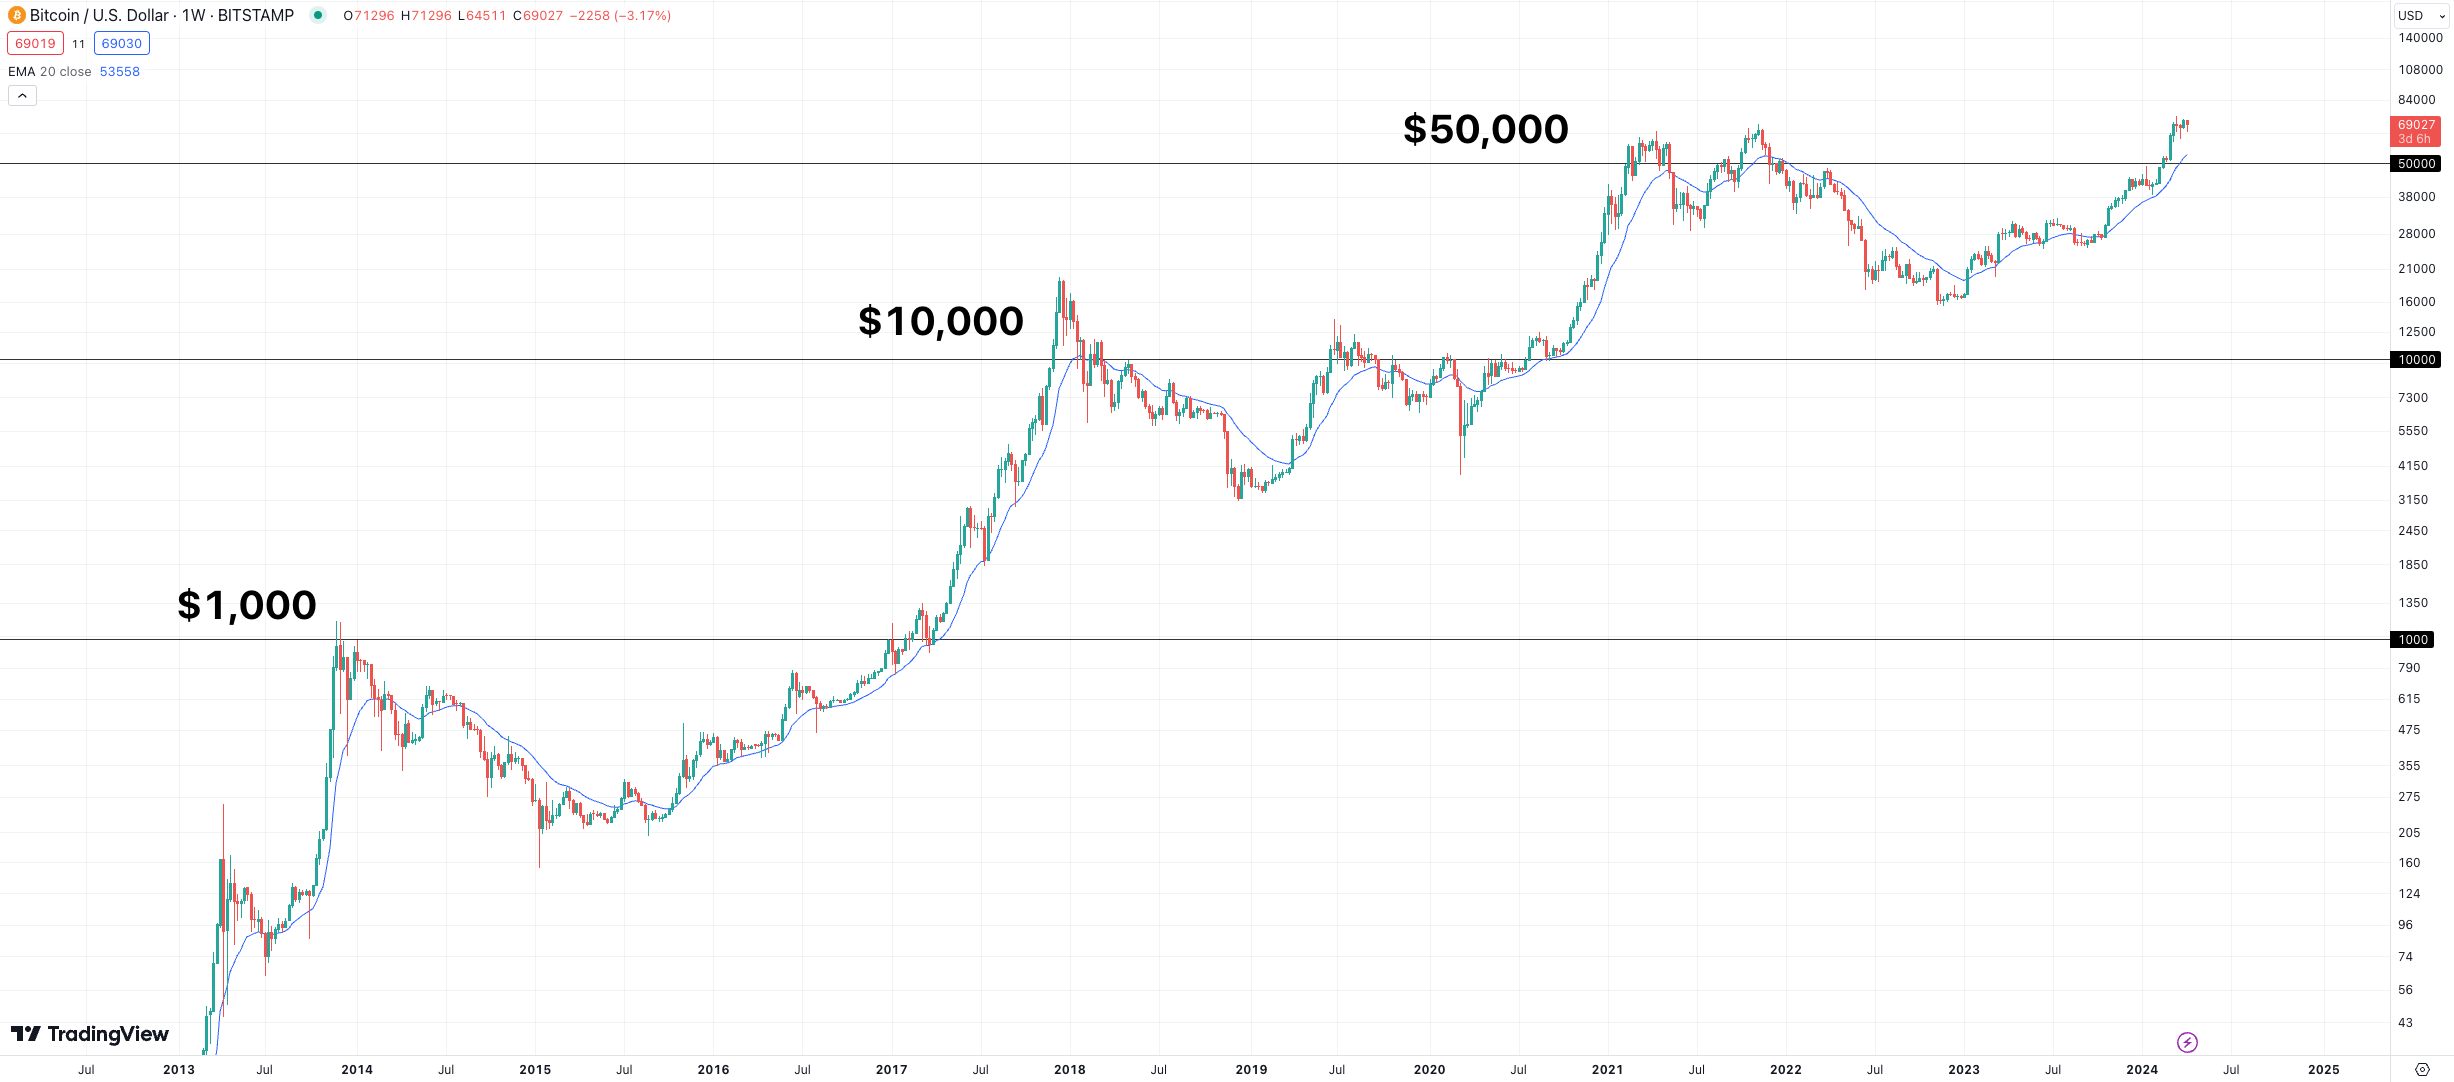
Bitcoin Price History
Bitcoin, the OG of the crypto market, has been on a remarkable journey since it first appeared in 2009. Created by the anonymous Satoshi Nakamoto, this revolutionary digital asset has evolved from an experiment into a globally recognized (and widely adopted) asset class.
In its early years, Bitcoin was largely dismissed as a joke, trading at just a few cents per coin. However, as the idea of decentralized borderless money gained traction, its value began to soar.
The first significant price surge took place in November 2013, when Bitcoin breached the $1,000 mark for the first time. This led to widespread interest in the coin, yet most serious investors still viewed it as a curiosity.
Subsequent years witnessed continued volatility and price swings, mainly due to security concerns and the emergence of new cryptocurrencies — called “altcoins” — vying for market share. Despite these challenges, Bitcoin continued its rise, passing $15,000 in January 2017.
The years 2019 and 2021 further cemented Bitcoin as a force to be reckoned with. In the latter, Bitcoin’s price soared to a staggering $68,789, representing a 9,100% increase from the start of 2017.
However, after hitting its peak, the crypto market entered a “crypto winter,” reminding people that volatility goes both ways. During this period, Bitcoin plunged as low as $15,700 in November 2022. At that point, most mainstream sentiment turned pessimistic.
What is a crypto winter?
A crypto winter is an extended period of declining prices and reduced trading volumes. This is often triggered by adverse events or broader economic conditions. For example, in 2022, the FTX exchange collapsed, and inflation levels soared, leading to a “risk-off” sentiment in the crypto market.
Fortunately for crypto investors, 2023 marked a turning point. Bitcoin staged an impressive recovery, breaking through the $30,000 mark by April. The latter half of 2023 was particularly bullish, with the coin ending the year at around $42,000.
Then came 2024, a year that reshaped Bitcoin’s trajectory. The SEC approved 11 spot Bitcoin ETFs, which caused a short dip under $40,000 but soon ignited the next major rally. Bitcoin reached a new record above $73,000 in March 2024, then finally broke into six-figure territory on December 5, 2024, when it traded above $100,000 for the first time.
By early March, Bitcoin had not only returned to 2021’s all-time high but had surged past the $70,000 mark into uncharted territory. On March 14, the coin posted a new all-time high of $73,750, putting its market cap at over $1.4 trillion. After a landslide victory by the first “pro-crypto” president, Donald Trump late in 2024, Bitcoin surged to another all-time high of .
In 2025, Bitcoin continued setting new highs, climbing to around $109,000 in January and then peaking at about $126,000 in early October 2025 before a multi-week correction brought the price back below $100,000. At the time of writing, Bitcoin has pulled back from that peak and is ranging around the 95k mark. However, as we’ll show in our Bitcoin price forecasts, many analysts and investors believe this is just a temporary consolidation before the next upward leg.
Bitcoin Price History: Key Milestones
- Bitcoin was created in 2009 by the anonymous Satoshi Nakamoto.
- In November 2013, Bitcoin reached $1,000 for the first time.
- In January 2017, Bitcoin passed $15,000.
- Bitcoin went on to reach a high of $68,789 in November 2021.
- The crypto winter of 2022 took hold and saw Bitcoin’s price plummet below $16,000.
- In January 2024, the SEC approved spot Bitcoin ETFs in the U.S., leading to BTC hitting a new all-time high of $73,750 just two months later.
- In November 2024, Trump was elected as the first “pro-crypto” president, sending Bitcoin soaring to a new all-time high of $93,434.
- In January 2025, on Trump’s inauguration day the price of bitcoin hit another all-time high of $109,079.
- In May 2025, after Trump’s tariffs for China showed some easing the price of bitcoin hit another ATH of $111,814.
- In October 2025, following the first rate cut in 2025 from the Federal Reserve, BTC hit a new ATH of $126,286.
Recent Developments and News for Bitcoin
Bitcoin is gaining increasing importance in both finance and technology. Governments are adjusting their policies, large investors are buying in directly, and the network itself is improving. These updates help explain what’s driving Bitcoin forward and what could come next.
Bitcoin Breaks $100,000
After years of predictions, Bitcoin finally crossed into six-figure territory in late 2024. It pushed as high as $110,500 by May 23rd 2025. This move was largely driven by growing institutional interest, steady inflows into spot ETFs, and a broader reevaluation of Bitcoin’s role in the financial system.
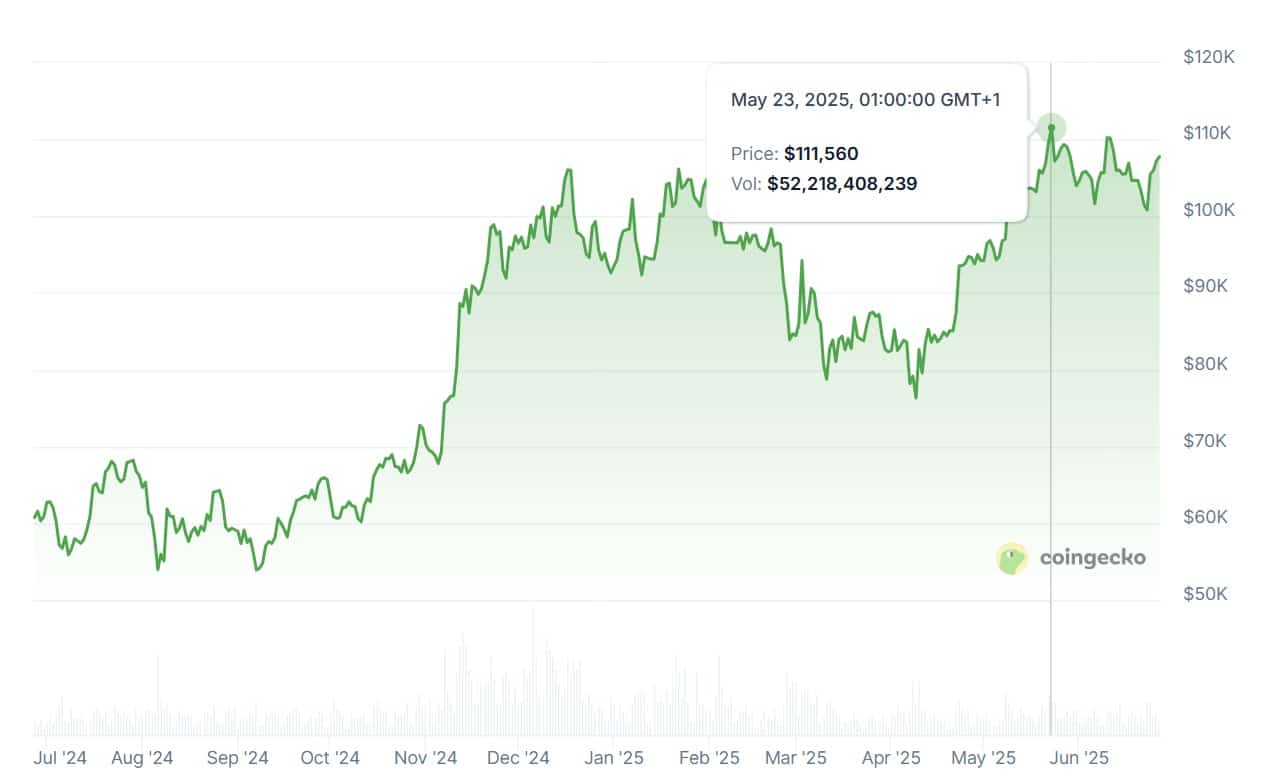
It wasn’t just a speculative spike. It came with deep pockets backing it.
U.S. Executive Order Creates Strategic Bitcoin Reserve
In March 2025, the U.S. government signed off on a Strategic Bitcoin Reserve, using Bitcoin seized from criminal activity. This wasn’t about regulation or enforcement. It was about positioning. Holding Bitcoin as a reserve asset shows the U.S. is beginning to treat it less like a risk and more like a resource with long-term value.
Institutional Adoption Accelerates
Big money is no longer sitting on the sidelines. Early in 2025, ProCap Financial, headed by Anthony Pompliano, raised over $750 million for direct Bitcoin purchases.
Their goal is to build a $1 billion position. This strategy mirrors what MicroStrategy did and reinforces the idea of Bitcoin as a hedge and reserve asset for corporations, not just governments.
Regulation Turns a Corner
U.S. regulators have pulled back in ways that matter. In 2024 and 2025, the Department of Justice shut down its crypto enforcement task force. At the same time, the OCC and FDIC loosened rules on banks holding and using Bitcoin. The result is a clearer path for U.S. banks to integrate crypto without waiting for case-by-case approvals.
Bitcoin’s Tech Stack Evolves
On the technical side, Taproot adoption is progressing slowly but steadily. It’s laying the foundation for smarter, more private contract functionality. The Lightning Network has also received an upgrade through Taproot Assets v0.6, which now supports stablecoin and digital asset issuance on Bitcoin rails. These upgrades are pushing Bitcoin beyond just a store of value toward a programmable infrastructure for digital finance.
Bitcoin Price Prediction for 2026
2025 proved to be a pivotal year for Bitcoin, and in 2026 the crypto market could build on that momentum. As mentioned in the section above, multiple spot BTC ETFs were approved in the U.S., and Donald Trump was elected as a pro-crypto president, paving the way for increased institutional adoption.
As a result, the crypto market has witnessed a massive influx of capital — with estimates suggesting that up to $100 billion in new investment could flow into Bitcoin alone. This surge in demand and Bitcoin’s scarcity set the stage for a huge price rally in the first to later half of 2025. We all know what followed next.
Buy Bitcoin with Best WalletBitcoin Halving Effect
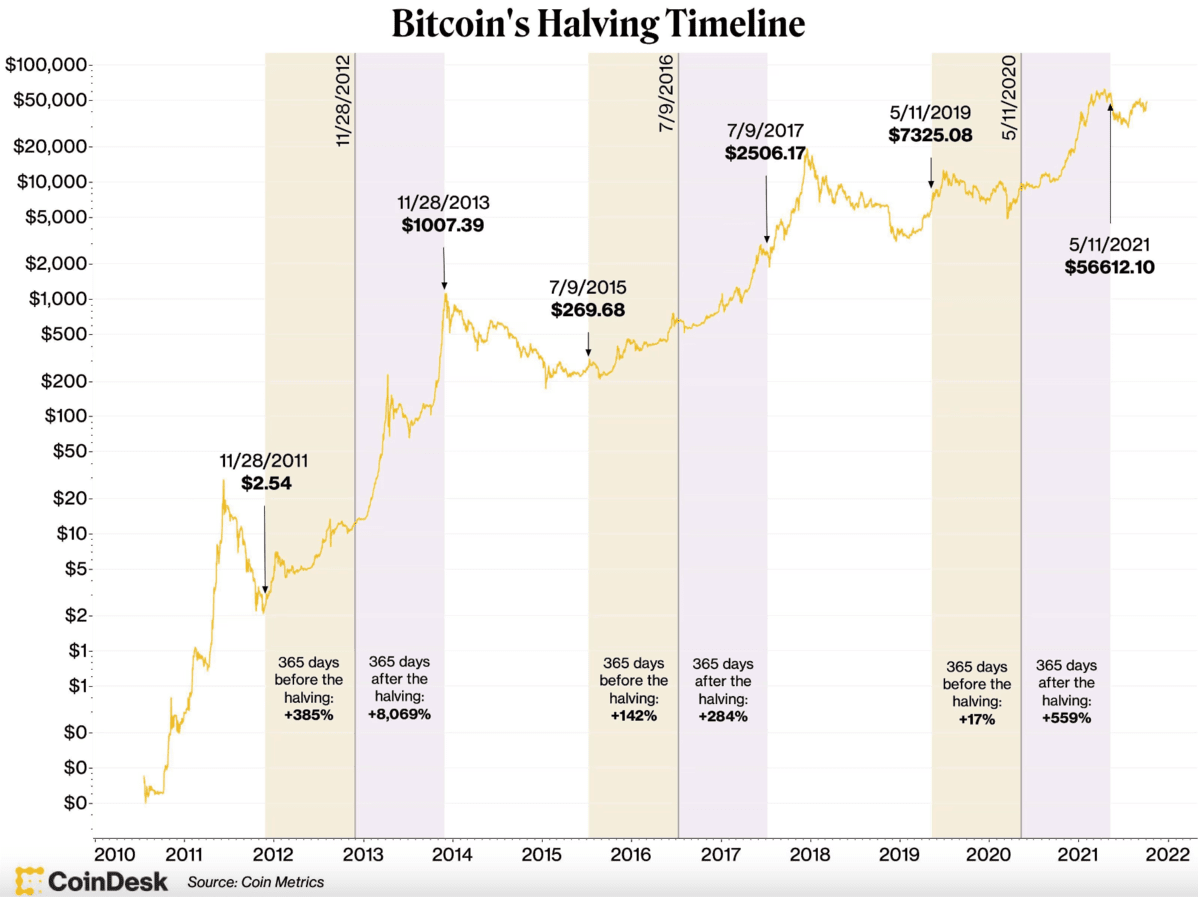
Another catalyst that contributes greatly to BTC’s price movements is none other than the Bitcoin halving. This event, which occurs every four years, cuts the reward for mining new Bitcoin blocks by half, reducing the supply of new BTC entering circulation. The April 20 2024 halving reduced the number of BTC mined in each block to 3.125.
Historically, halving events have been followed by bull runs as the decreased supply meets a growing demand for Bitcoin. Just one year after the May 2020 halving, Bitcoin reached an all-time high above $64,000, representing a gain of over 650% from its pre-halving price.
Lower Interest Rates
Adding to the bullish sentiment, our Bitcoin price prediction also considers the decrease in the Federal Funds rate. While high interest rates are usually seen as a headwind, they didn’t stop Bitcoin from rallying in 2024. The Federal Reserve began to make significant cuts to the interest rate in late 2024 and throughout 2025.
Therefore, Bitcoin may look even more appealing to investors. Lower interest rates typically diminish the appeal of traditional fixed-income investments like bonds, prompting investors to seek other assets with high growth potential. Bitcoin could benefit from this shift.
Throw in the potential for increased liquidity and government money printing in 2026, and we could be looking at multiple macro-economic factors pushing Bitcoin to new heights.
Improving Regulatory Conditions
Regulatory developments will also likely play a role in shaping Bitcoin’s price trajectory in 2026. With governments now recognizing the need for clear regulatory frameworks for cryptocurrencies, we could witness more favorable policies being implemented to protect investors’ interests.
Such developments would enhance market confidence and facilitate greater investor participation. If regulations are deemed clear and fair, everyday investors, especially those who view the crypto market with trepidation, might be convinced to finally invest in Bitcoin.
Taking all these factors into account, our BTC price prediction for 2026 remains optimistic. We anticipate that the combination of growing institutional adoption, the halving event, and potential interest rate cuts could push Bitcoin to a new all-time high, potentially around $150,000 by the end of the year.
Bitcoin Price Prediction for 2026
Giving a BTC price prediction for 2026 is challenging due to how unpredictable the coin’s movements can be. However, if Bitcoin does experience another rally in 2026, as we expect, then the cycle could reverse course in mid 2026.
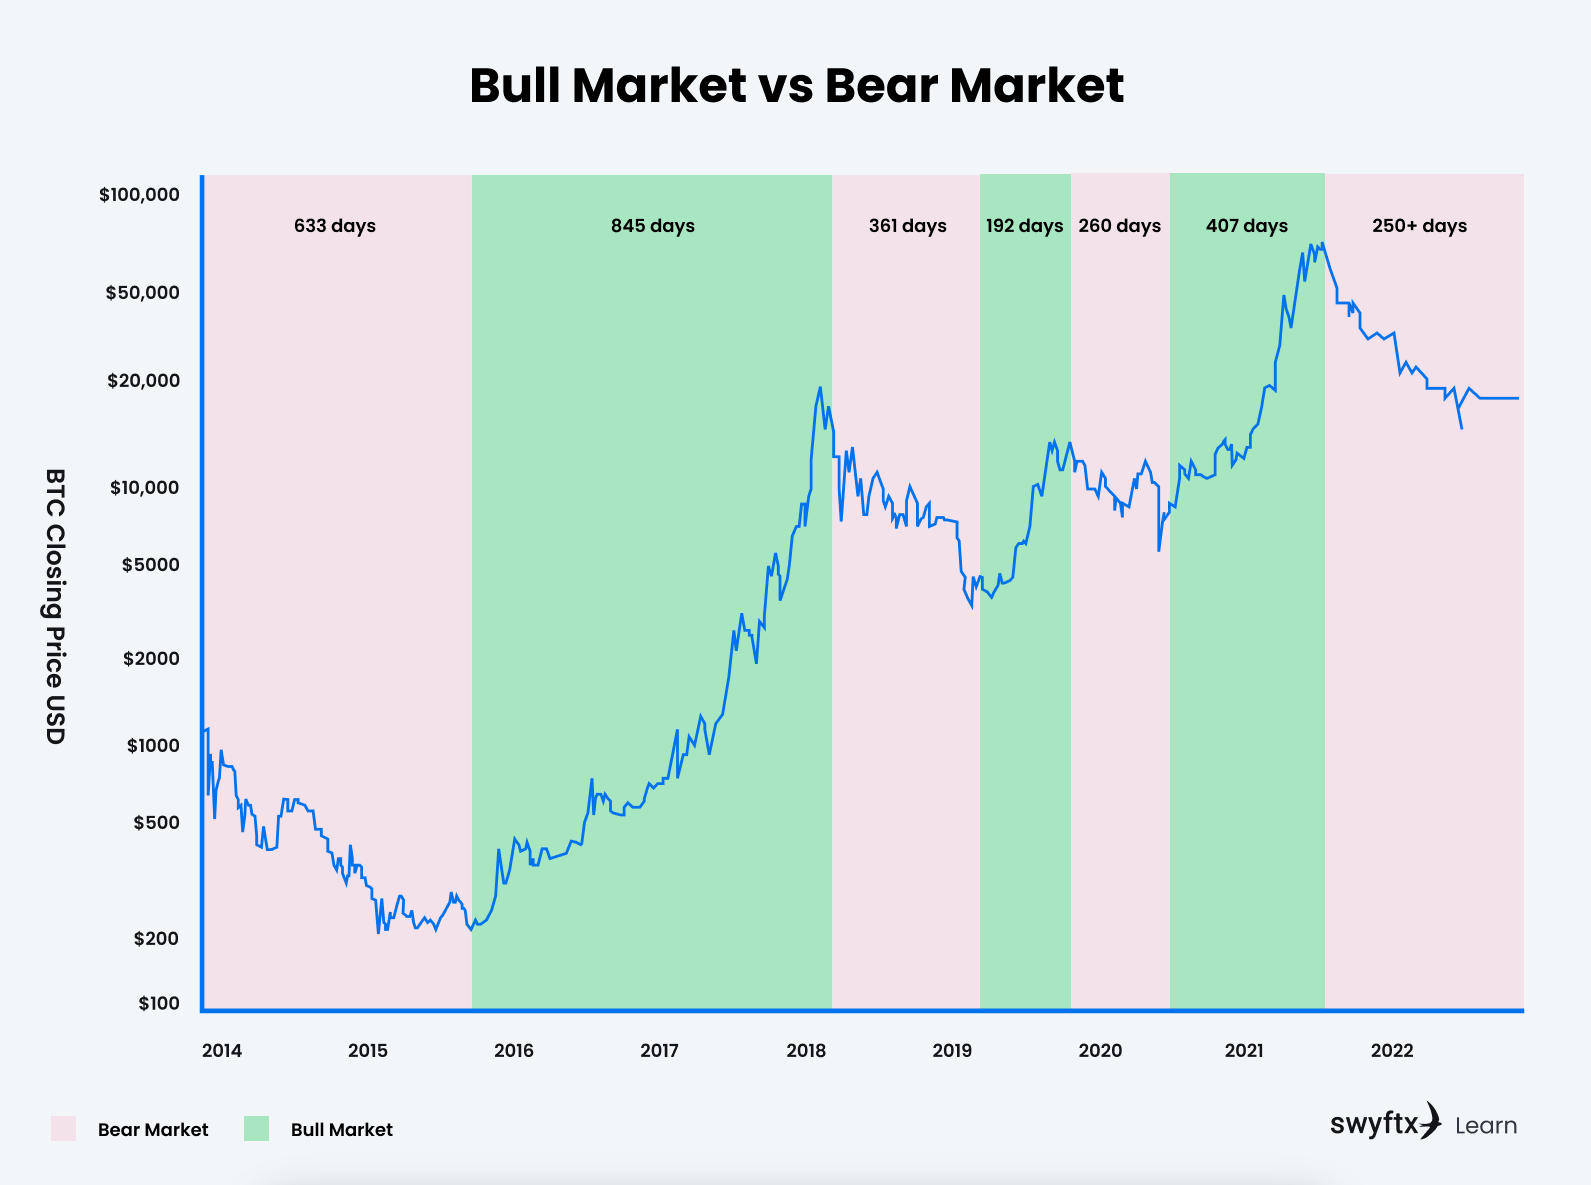
History has shown that periods of price appreciation in the crypto space are often followed by consolidation or correction periods. This pattern is not unique to Bitcoin: it is usually seen across other asset classes, like stocks and commodities.
Inflated valuations often give way to profit-taking and a more rational assessment of risk. When this happens, investors usually describe it as a “bear market” or the previously mentioned “crypto winter.”
It’s worth noting that Bitcoin’s first-mover advantage could provide some form of a hedge against a complete collapse, even in a bearish scenario. However, investors should be prepared for the possibility of an extended pullback or consolidation phase.
As such, our BTC price forecast for 2026 estimates that the coin could drop as low as $80,000 — with an average price throughout the year of $115,000.
Bitcoin Price Prediction for 2030
Our Bitcoin price prediction for 2030 is underpinned by several factors that could once again push the coin to new heights. The first is the anticipated growth of Bitcoin as a payment option. As more merchants embrace digital currencies, the demand for BTC could surge – translating to higher prices.
Additionally, the development of scalable layer-2 solutions, like the Lightning Network, would fast-track global adoption. Bitcoin’s integration into traditional financial systems could also make it easier for merchants to accept it as a payment option.
Another event that could impact Bitcoin in the run-up to 2030 is the 2028 Bitcoin halving. Like the 2024 halving, this one will reduce the new BTC entering circulation even more and could increase price pressure.
Moreover, increasing interest from institutional investors and sovereign wealth funds may provide a wave of capital into the crypto market. As these deep-pocketed players recognize the potential of Bitcoin as a store of value, their involvement could also boost the coin’s price.
Considering all of these factors, our Bitcoin price prediction for 2030 is bold. We anticipate that by the end of the decade, Bitcoin could hit $400,000. Should it reach this level, it would represent a 4x increase from today’s price.
Long-Term Bitcoin Price Forecast for 2040
Predicting the price of Bitcoin a decade and a half into the future is a shot in the dark, as unforeseen events and technological advancements could easily reshape the crypto landscape. However, here are some potential factors that our Bitcoin price prediction for 2040 takes into consideration:
- Environmental Concerns: Bitcoin’s energy-intensive mining process has long been a subject of criticism. A major environmental event or heightened global awareness of the climate crisis could lead to scrutiny of Bitcoin’s carbon footprint, thus hindering adoption.
- Technological Disruption: While Bitcoin was the OG cryptocurrency, its underlying technology might be considered old-fashioned by 2040. The emergence of new, more efficient blockchain platforms or consensus mechanisms could render Bitcoin obsolete.
- Geopolitical Events: Extreme global political events, such as wars or the collapse of fiat currencies, could drive people to seek refuge in decentralized assets like Bitcoin. This flight to safety could boost demand — and price.
Considering these factors, our Bitcoin price forecast for 2040 is relatively conservative. We anticipate that Bitcoin could maintain its position as a widely recognized store of value, trading within a range of $250,000 to $500,000 per coin by the end of the decade. However there remains a possibility of Bitcoin reaching over $1 million per coin by 2040.
Methodologies Used in Our Bitcoin Price Predictions
We have used and aggregated several methodologies in order to come up with our BTC price projections, namely:
- Time series analysis, where we analyzed data sequences over several time periods to identify trends, seasonal patterns, or cycles.
- Regression analysis, where we examined the relationship between price consumer trends, interest rates, and more.
- Technical analysis, where we used charts and historical price data to identify patterns, support and resistance levels, and other technical indicators to make predictions.
- Retail & institutional sentiment analysis, where we took into account the market’s overall mood, including public opinion and investor sentiment, but also different reports and predictions from notable parties.
Popular Analysts’ Bitcoin Forecasts
Our Bitcoin price prediction is just one opinion – countless other perspectives are out there. With that in mind, here are five alternative predictions from crypto market experts:
JMP Securities
JMP Securities analysts believe Bitcoin’s pricecould reach $280,000 within three years. They cite anticipated Bitcoin ETF inflows, estimating around $220 billion of incremental flows over this period — leading to a potential 25x multiplier on Bitcoin’s price.
FXTM
Lukman Otunaga, a senior market analyst at FXTM, stated that the average price prediction across their sources is $123,056 for Bitcoin. He believes the psychological level of $80,000 could act as resistance, but once breached, Bitcoin could rally from current levels to tap the average predicted price.
Tom Lee
Tom Lee, co-founder of Fundstrat Global Advisors, also has a bullish outlook. He predicts Bitcoin could reach $150,000 within the next 12 months and potentially hit $500,000 within five years. His prediction is based on increasing demand, the recent Bitcoin halving event, and the potential easing of monetary policy.
Ark Invest
Cathy Wood’s Ark Invest released the “Big Ideas” research report, covering their predictions for the crypto market in the following decade. They state that Bitcoin’s price will reach $1 million by the end of the decade without trouble, explaining their prediction by growing fundamentals, namely an increasing hashrate, long-term holder supply, and non-zero-balance address increase.
While their bear case predicts a CAGR of 40% and a price of $285,500 by 2030, their bull case puts BTC at $1.48 million by the end of the decade.
Wood revised this prediction further in March 2024, when she called BTC at $1.5 million by 2030.
What Is Bitcoin and What Is It Used For?
Bitcoin is a decentralized digital currency (a cryptocurrency) that operates on a technology called “the blockchain.” It was created to act as programmable money that allows for secure, borderless peer-to-peer transactions without the need for a centralized intermediary, such as a bank or government.
What Is Blockchain Technology?
Blockchain technology is a digital ledger that records transactions in atransparent manner. It’s essentially a chain of blocks, each containing data about multiple transactions.
Once a block is added to the chain, it can’t be changed or removed. This allows people to trust the data recorded on the blockchain without needing a middleman.
Importantly, unlike traditional fiat currencies, Bitcoin is not issued or controlled by any single entity. Instead, it is created through a process called “mining,” where powerful computers solve complex mathematical problems to validate transactions.
While Bitcoin was initially created as a medium of exchange for electronic transactions, its use cases have expanded massively over the years. Here are some of Bitcoin’s primary applications:
- Digital Payments: Bitcoin can be used to purchase goods and services online or at physical locations that accept it as a form of payment. According to the latest data, over 10,000 locations worldwide now accept BTC.
- Investing: Due to its limited supply, many investors view Bitcoin as a potential store of value, similar to gold. This makes it a popular hedge against inflation and economic uncertainty.
- Remittances: Bitcoin’s low transaction fees make it attractive for people sending money back to their home countries. This is especially true for people who live in regions with underdeveloped banking systems.
- Ordinals: Ordinals allow for the creation of unique digital assets directly on the Bitcoin blockchain from the smallest unit of Bitcoin (called satoshis). These inscribed satoshis, often carrying images, introduce NFT-like capabilities. Since the start of 2024, there has been over $3 billion in Ordinals sales volume.
Aside from all of this, Bitcoin is increasingly being integrated into decentralized finance (DeFi) platforms, allowing users to lend, borrow, and earn interest on their BTC holdings, expanding its utility beyond traditional markets. As Bitcoin adoption continues to grow, its use cases are likely to expand even further. This has the potential to revolutionize various industries and even challenge legacy financial systems.
What Influences the Price of Bitcoin?
As those who buy Bitcoin regularly will know, the coin’s price is influenced by many factors, both internal and external to the cryptocurrency market. These include:
Crypto Market Sentiment
It’s easy to see from the Bitcoin price chart that the coin’s price is heavily influenced by the overall sentiment within the crypto market. When the market is bullish, investors are optimistic, and money flows into Bitcoin. In turn, this often drives up its price.
However, investors may seek “safer” assets during bearish periods or market downturns. This can lead to decreased demand for Bitcoin and a corresponding drop in its value.
Supply & Demand
Like any other financial asset, Bitcoin’s price is governed by the fundamental principles of supply and demand. Since Bitcoin has a finite supply (21 million coins), increasing demand heavily influences its price.
A prime example is the recently launched spot Bitcoin ETFs in the U.S. These ETFs have led to a massive uptick in institutional demand as they provide conventional investment vehicles that investment and pension funds, and other large players can use to gain exposure to BTC.
This increased demand from institutional money has helped drive Bitcoin’s price higher in recent months — and was a key catalyst for hitting a new all-time high in mid-March.
Adoption & Use Cases
Bitcoin’s price is heavily influenced by growing adoption and expanding use cases. As more businesses and individuals embrace Bitcoin for transactions, payments, and investment purposes, the demand for the coin is likely to increase.
There are even new use cases for Bitcoin that previously seemed impossible. For example, digital assets can be inscribed directly onto the Bitcoin blockchain through a technology called Ordinals. As more people become aware of these use cases, it could drive further interest in Bitcoin.
Regulatory Environment
The regulatory landscape surrounding cryptocurrencies is another critical factor influencing Bitcoin’s price movements. Favorable regulations, such as the approval of spot Bitcoin ETFs back in January, can boost investor confidence and drive adoption.
Conversely, strict regulations or outright bans can dampen market sentiment and hinder adoption. A famous example is when China banned Bitcoin mining and crypto exchanges within its borders, triggering a sharp price decline for BTC.
Macroeconomic Factors
Lastly, Bitcoin’s price isn’t immune to broader macroeconomic conditions affecting traditional financial markets. Factors such as inflation rates, interest rate policies, geopolitical events, and overall economic performance can (and do) impact investor sentiment and the perceived value of Bitcoin.

These factors interact in complex ways to shape Bitcoin’s price movements. Understanding and monitoring them is crucial for investors since they can provide valuable insight into potential price trends.
2024 Bitcoin Halving
As mentioned earlier, the Bitcoin halving event is crucial for maintaining the coin’s scarcity and value. In simple terms, the halving is when the reward for mining new Bitcoin blocks is reduced by 50%.
Here are the key points to remember regarding the 2024 Bitcoin halving:
- The halving occurs roughly every 210,000 blocks, or approximately every four years, to control the supply of new bitcoins entering circulation.
- By reducing the supply of new bitcoins while demand remains constant (or increases), the halving event could drive up prices due to the law of supply and demand.
- As of April 20, miners receive 3.125 bitcoins for every new block they add to the blockchain.
- The next Bitcoin halving will occur in 2028.
Significant price rallies for Bitcoin have followed previous halving events. For example:
- In the 12 months following the 2012 halving, Bitcoin’s price rallied over 8,300%.
- In the 12 months following the 2016 halving, Bitcoin experienced a gain of over 288%.
- In the 12 months following the 2020 halving, Bitcoin surged over 650%.
While past performance doesn’t guarantee future results, the 2024 halving generated considerable excitement in the crypto community. Coupled with the demand shock caused by the ETF approval, BTC halving adds to the scarcity as it introduces a supply shock as well.
Is Bitcoin a Buy Right Now?
So, is Bitcoin a good investment? Or is it better to wait on the sidelines? On one hand, the crypto market is currently buzzing with bullish sentiment surrounding the halving event. As highlighted in this guide, these halvings often act as a positive catalyst.
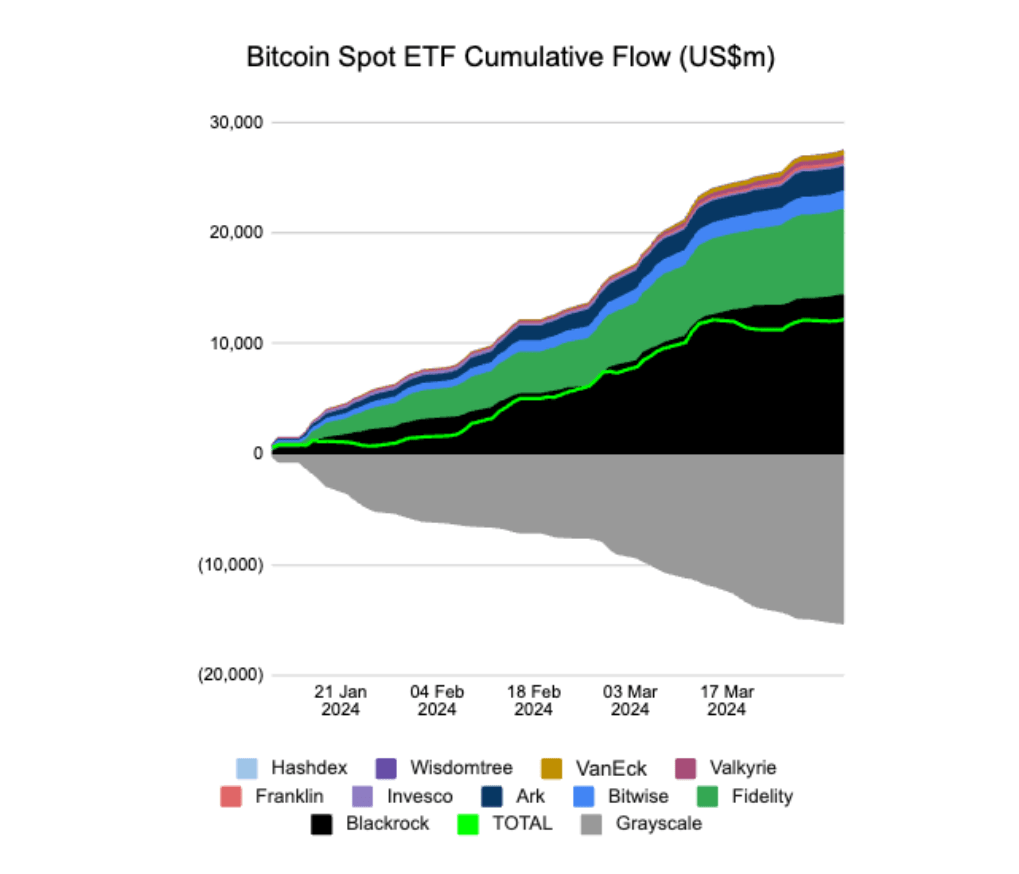
The growing adoption of Bitcoin by institutions is adding fuel to the fire. According to BitMEX Research, the 11 SEC-approved spot Bitcoin ETFs saw over $12 billion in total inflows during Q1 2024. BlackRock’s offering has been the biggest winner, while the Grayscale Bitcoin Trust is a key outlier, having seen billions in outflows.
Moreover, the potential for interest rate cuts later in the year could make Bitcoin a more attractive investment proposition. With traditional assets like bonds offering lower yields, investors may flock to Bitcoin to generate higher returns.
However, it’s essential to approach any investment with a healthy dose of caution. The crypto market remains highly volatile and seasonal, and unexpected regulatory hurdles or shifts in market sentiment could quickly derail Bitcoin’s uptrend.
Ultimately, investing in Bitcoin should be based on one’s own risk tolerance and investment objectives. Although our Bitcoin price prediction estimates that BTC could top $200,000 by the end of 2026, this is just our opinion and shouldn’t be considered investment advice.
If you are looking to pick some Bitcoin up, we recommend the following exchanges as we’ve reviewed, tested, and personally used the mentions below:


Best Wallet is our top pick for users looking for the easiest way to buy Bitcoin from directly within a wallet. Best Wallet allows users to buy, sell, and swap crypto from directly within the wallet using the built-in DEX-aggregator.

The reason we recommend Best Wallet for new users and those looking for the most friction-free way to buy Bitcoin is that by purchasing crypto from directly within a wallet, users lower their risk of exposing themselves to exchange hacks, third-party risks, and the possibility of sending to incorrect addresses when withdrawing from a traditional crypto exchange. The Best Wallet DEX aggregator sources the best rates for users’ swaps, supporting 50+ chains, connecting to over 200 decentralized exchanges, and using up to 20 cross-chain bridges. Users can make both same-chain and cross-chain swaps.
Visit Best WalletBitcoin Price Prediction: Conclusion
In conclusion, Bitcoin’s long-term outlook remains one of strength, resilience, and global relevance. The combination of reduced supply from the 2024 halving and the growing influx of institutional capital, spurred by spot Bitcoin ETF approvals, has set the stage for a potential new era of price discovery. With broader mainstream adoption, rising network activity, and continued integration into traditional finance, the world’s largest cryptocurrency could be entering one of the most pivotal growth phases in its history. Crypto may soon be hitting its inflection point.
Short-term fluctuations are inevitable, but Bitcoin has repeatedly shown its ability to recover and thrive after every market downturn. If history rhymes, the current cycle could push BTC to new all-time highs, possibly reaching or even surpassing the $150,000 mark by the end of 2026. Beyond that, the five-year horizon opens up even more intriguing possibilities. As global trust in fiat currencies wavers and digital assets gain legitimacy, Bitcoin’s narrative as “digital gold” only grows stronger.
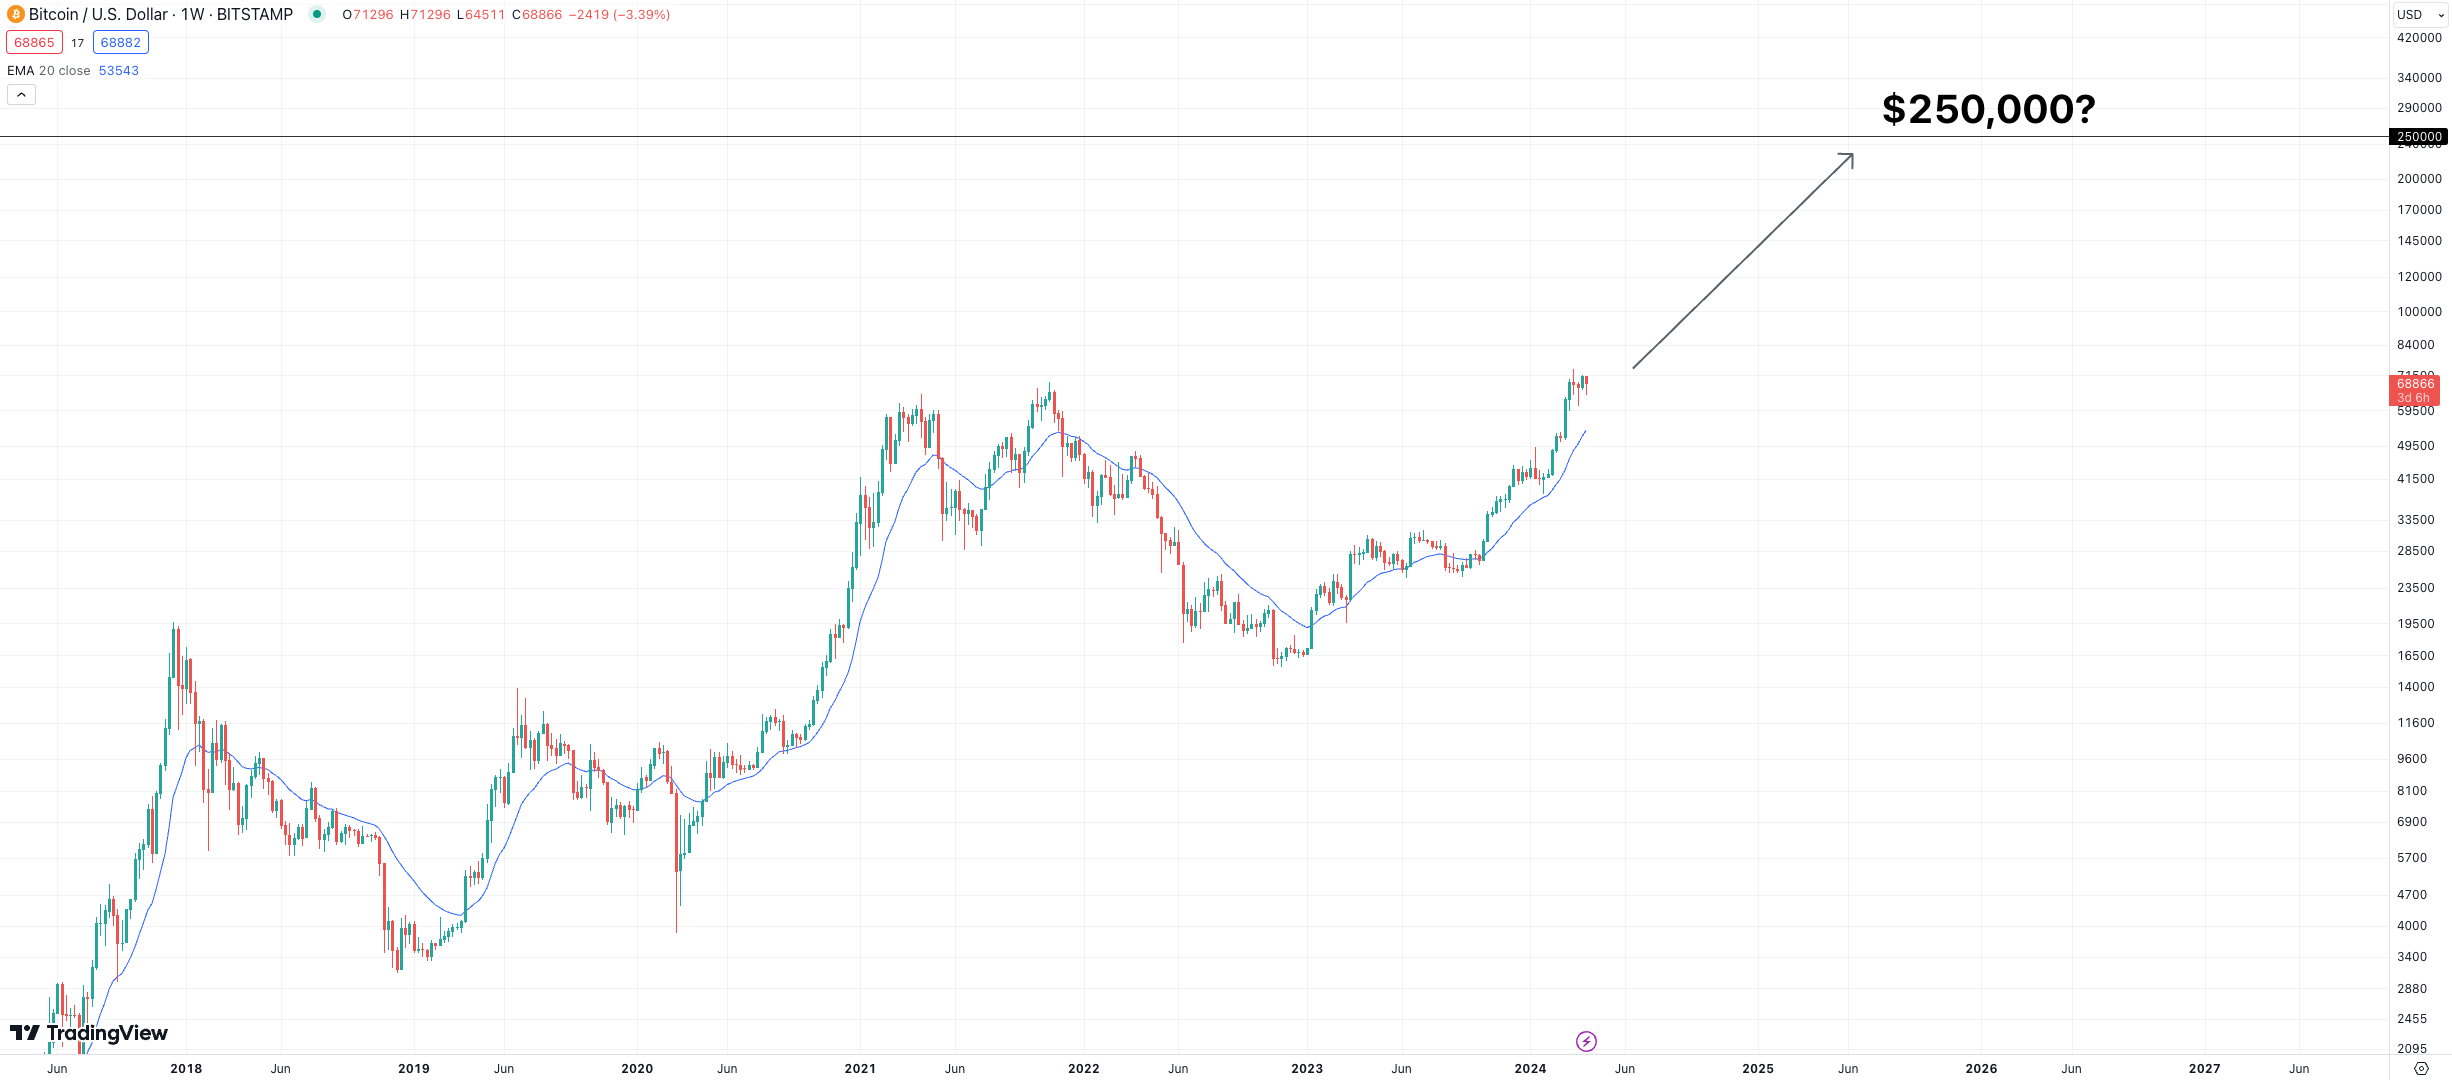
Whether Bitcoin ultimately climbs to $250,000, or one day hits that once-unthinkable $1 million milestone, it’s clear the asset has matured far beyond its experimental beginnings. For investors with patience and conviction, Bitcoin’s story still feels like it’s just getting started.
While Bitcoin’s long-term prospects appear bullish, those seeking diversification (and higher return potential) may wish to read our comprehensive guide on the best cryptocurrencies to buy in 2026 and beyond.
Check Out Our Best Cryptos to Buy Guide
See also:
- Is Bitcoin a Good Investment in 2026?
- What is Bitcoin? A Detailed Explanation
- How Many Bitcoins Are Left in 2026?
- Bitcoin Futures: BTC Trading Guide For 2026
- What is Fidelity Wise Origin Bitcoin Fund (FBTC)?
- Will Bitcoin Hit $1 Million: How High Will Bitcoin Go?
FAQs
How much will Bitcoin be worth in 2025?

Our Bitcoin price prediction forecasts that BTC will reach a high of around $150,000 in 2025 and an average price of $105,000 throughout the year.
How much will Bitcoin be worth in 2030?
While long-term predictions are challenging, our analysis indicates that Bitcoin could trade as high as $400,000 in 2030.
How much will Bitcoin be worth in 2040?
Given the numerous factors that could influence its value, making accurate Bitcoin price predictions for 2040 is challenging. However, if scarcity does drive continued price appreciation, BTC could reach $500,000 by 2040.
Is now a good time to buy Bitcoin?
Given Bitcoin’s recent breakout to new all-time highs and the positive market sentiment surrounding the halving event, the current market conditions could present an opportune time to add Bitcoin to one’s portfolio.
References
- “Bitcoin.” bitcoin.org, Bitcoin.org,
https://bitcoin.org/en/. - Library of Congress. “Cryptocurrency & Blockchain.” Library of Congress Guides,
https://guides.loc.gov/fintech/21st-century/cryptocurrency-blockchain. - Gandal, Neil, et al. “Emerging Technology: Bitcoin and Crypto Assets.” U.S. Sentencing Commission, 2018,
https://www.ussc.gov/sites/default/files/pdf/training/annual-national-training-seminar/2018/Emerging_Tech_Bitcoin_Crypto.pdf. - Cohen, Matthew. “Cryptocurrency Adoption, Volatility, and Regulatory Effects.” Aquila, University of Southern Mississippi Honors Theses, 2021,
https://aquila.usm.edu/cgi/viewcontent.cgi?article=1961&context=honors_theses. - Commodity Futures Trading Commission. “Bitcoin Futures: An Introduction.” CFTC Office of Customer Education and Outreach, Dec. 2019,
https://www.cftc.gov/sites/default/files/2019-12/oceo_bitcoinbasics0218.pdf.
Why you can trust 99Bitcoins
Established in 2013, 99Bitcoin’s team members have been crypto experts since Bitcoin’s Early days.
Weekly Research
100k+Monthly readers
Expert contributors
2000+Crypto Projects Reviewed