
Why is crypto down Today? Bitcoin price is struggling to progress upside, but if Rektember collapses BTC USD, how long will it go?
As the Bitcoin price reaches a critical moment in its four-year market rhythm, doubts are rising. Traders are asking if this turning point could signal a steep drop ahead – here is the analysis.
Analysts caution that the coming month could bring either a sharp surge or a steep $50,000 correction. October is being pointed out as the key turning point.
Joao Wedson, founder and CEO of the crypto analytics firm Alphractal, clearly warned about Bitcoin’s outlook.
Judgment Day for Bitcoin Approaches?
Back in 2024, we pointed out that October 2025 could mark the completion of a fascinating Bitcoin fractal cycle. If true, this would signal the official closing of this phase in BTC’s history.
Of course, it would be reckless to assume that… https://t.co/3dtekdPCFN pic.twitter.com/ZtndPv0vCm
— Joao Wedson (@joao_wedson) September 3, 2025
He suggested that Bitcoin may be nearing the close of its four-year repetition cycle, and bear markets have historically followed it.
Wedson explained that Bitcoin’s 15% slide from its all-time highs could be an early sign of a longer downtrend.
He stressed that the current structure fits with Alphractal’s “Repetition Fractal Cycle” and October is usually the month when bearish momentum builds and market sentiment shifts.
Bitcoin Price Analysis: Is BTC’s Descending Channel Setting Up a Breakout or a Breakdown?
On the technical side, Bitcoin’s hourly chart shows a mixed setup. Price action has been consolidating after the recent volatility.
Candlestick movement shows a descending channel formed in late August. This was marked by consistently lower highs and lower lows.
The pattern forced Bitcoin down to the $109,500-$110,000 support zone. Buyers stepped in at this level to absorb selling pressure.
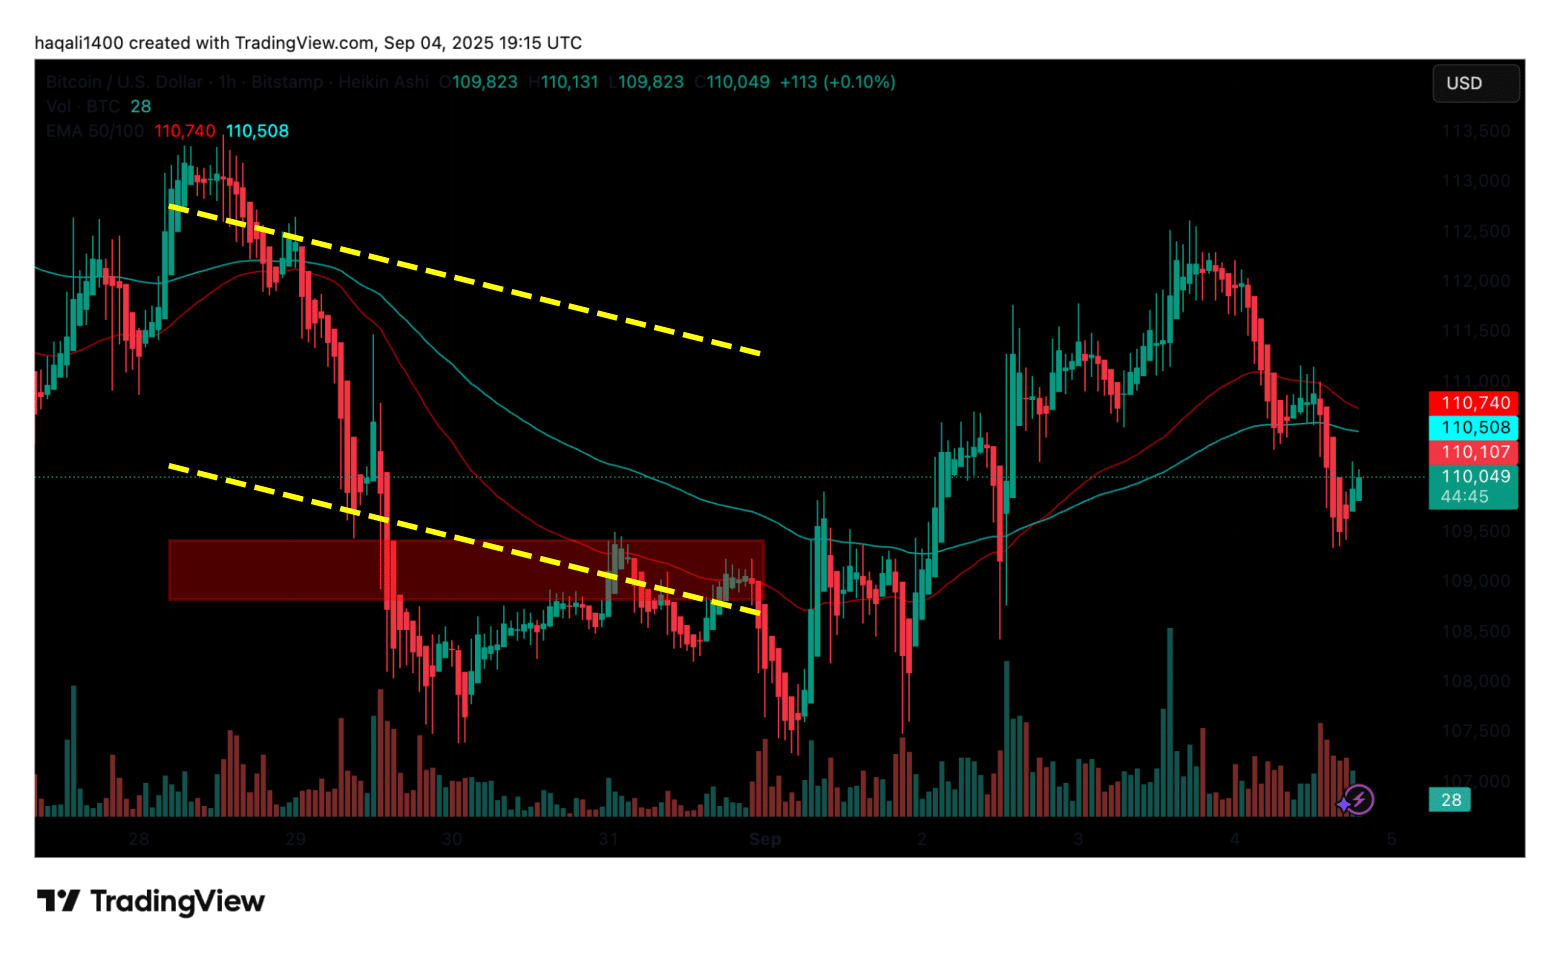
(Source – BTC USDT, TradingView)
Currently, Bitcoin price trades around $110,049, marking a decline of -2.5% just above that support area.
The 50-day and 100-day exponential moving averages are moving close together. This reflects uncertainty in the short term and the possibility of a sharp breakout.
If the $109,500 support breaks, selling could accelerate and drag the price toward $108,000. On the other hand, if the level holds, Bitcoin could retest resistance around $111,000-$112,000.
According to the CryptoQuant data, the Binance Bitcoin-to-stablecoin ratio is now close to 1, which has often lined up with market bottoms. The measure compares Bitcoin reserves with stablecoin reserves on Binance.
The last time it touched parity was in March, when Bitcoin dipped to $78,000 before staging a rally toward its $123,000 all-time high.
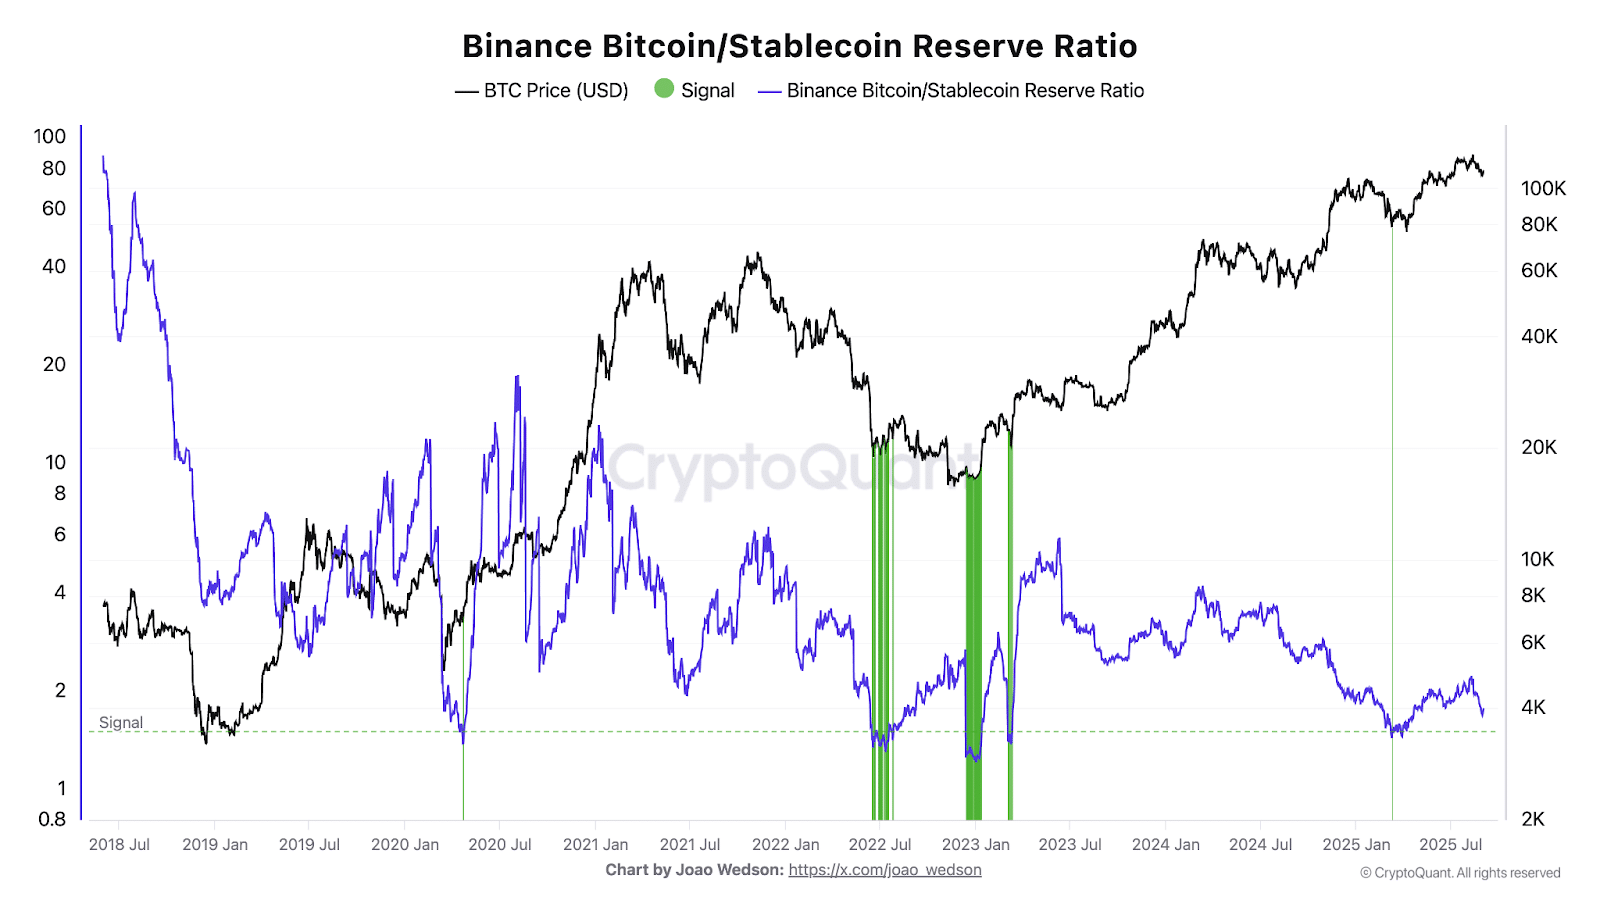
(Source: Bitcoin/Stablecoin Reserve Ratio – CryptoQuant)
This ratio has increased to such heights twice since the previous bear market.
The ratio has never been seen before during the previous cycles, except at the end of bear markets, and it flashed again in March 2023. Its renewal now might not indicate a bottom, but just indicate the beginning of a greater correction.
DISCOVER: Next 1000X Crypto: 10+ Crypto Tokens That Can Hit 1000x in 2025
Could a Drop Below $108K Trigger Forced Selling for Bitcoin?
Both directions also have hot spots on the Bitcoin liquidation heatmap provided by Coinglass.
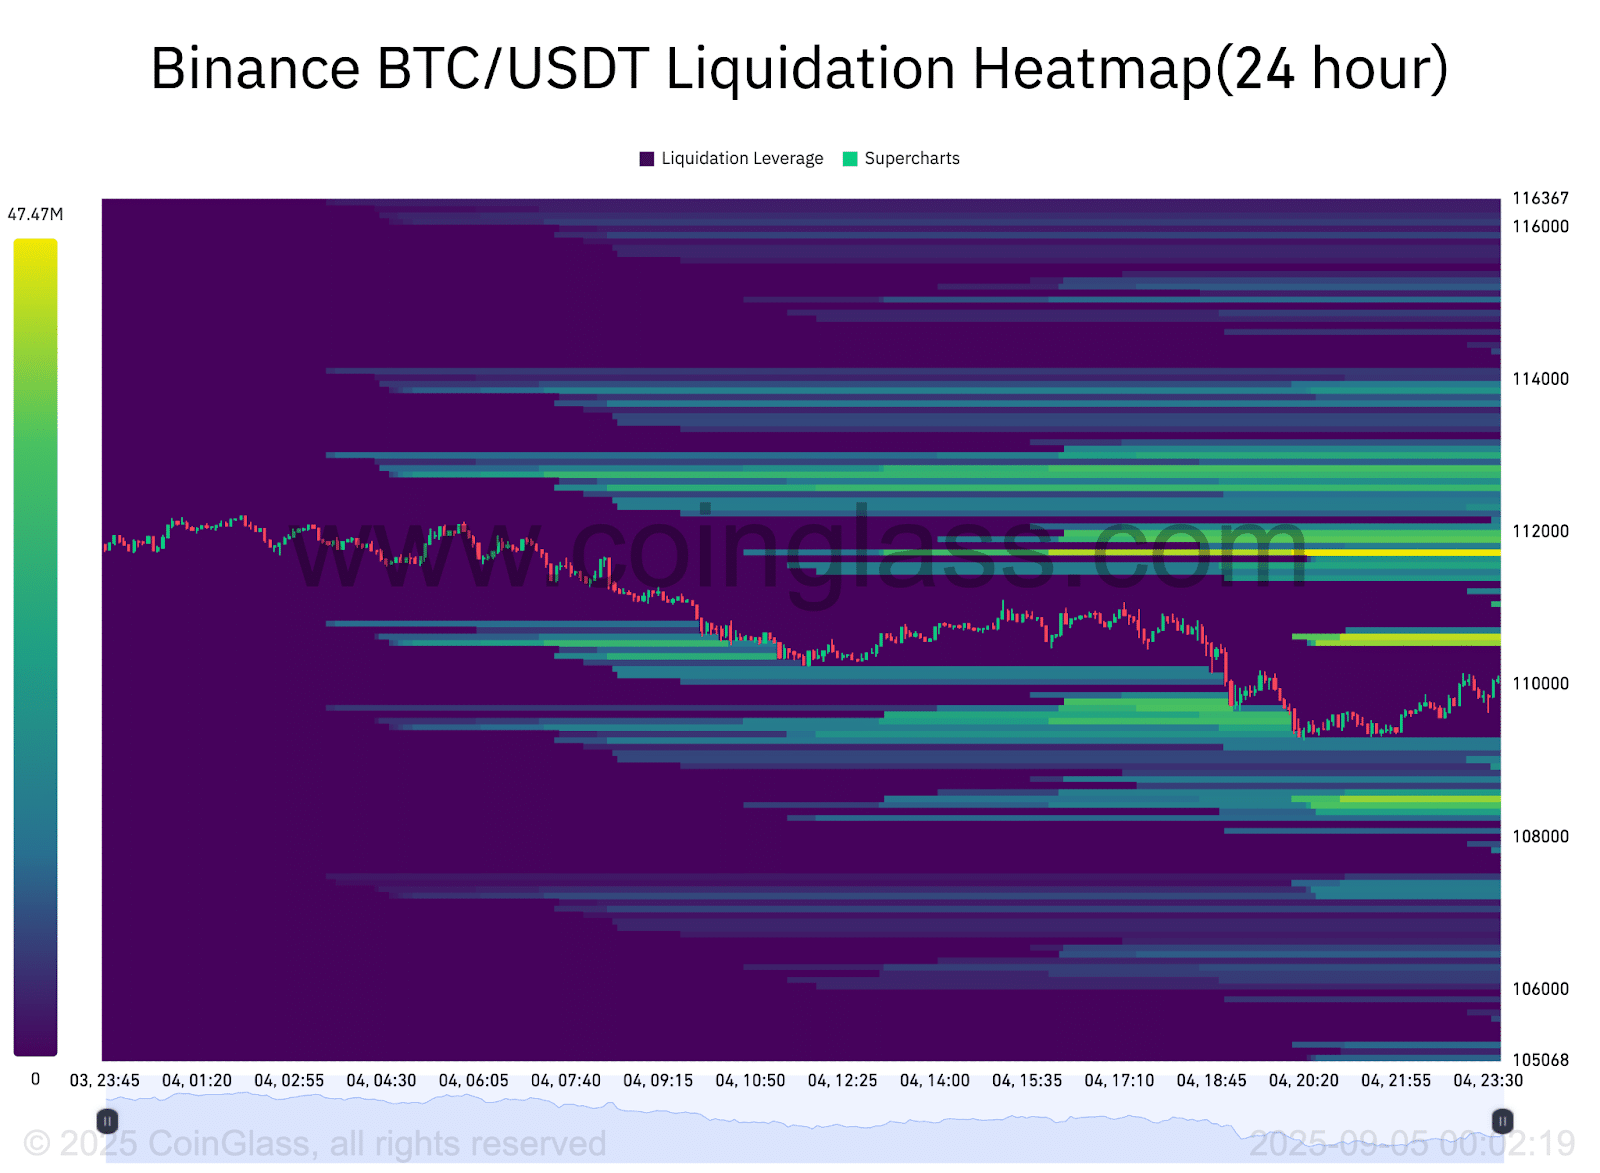
(Source: Bitcoin Liquidation Heatmap – Coinglass)
On the positive side, the liquidation leverage is between $112,000 and $114,000. Any further breakout would trigger a series of short liquidations, which would cause a squeeze in case momentum increases.
Liquidation levels are negative, between $108,000 and $106,000. Close to 20M-40M positions are resting in this range.
According to analysts, below this zone, forced selling may cause a more severe drop in Bitcoin price.
The overall liquidation structure indicates that the traders are distributed on either side. Shorts would be at risk below $108000, and longs would be at risk above $112000.
The heatmap highlights a current battle between bulls and bears and indicates that a big move may be acute after liquidity levels on either side are tested.
The latest Crypto Fear and Greed Index from CoinGlass reads at 56, which is neutral but leans toward greed.
This indicates that sentiment is slightly bullish even though traders are cautious. Historically, when the index moves into greed while Bitcoin trades near highs, markets often see short-term corrections as profit-taking starts.
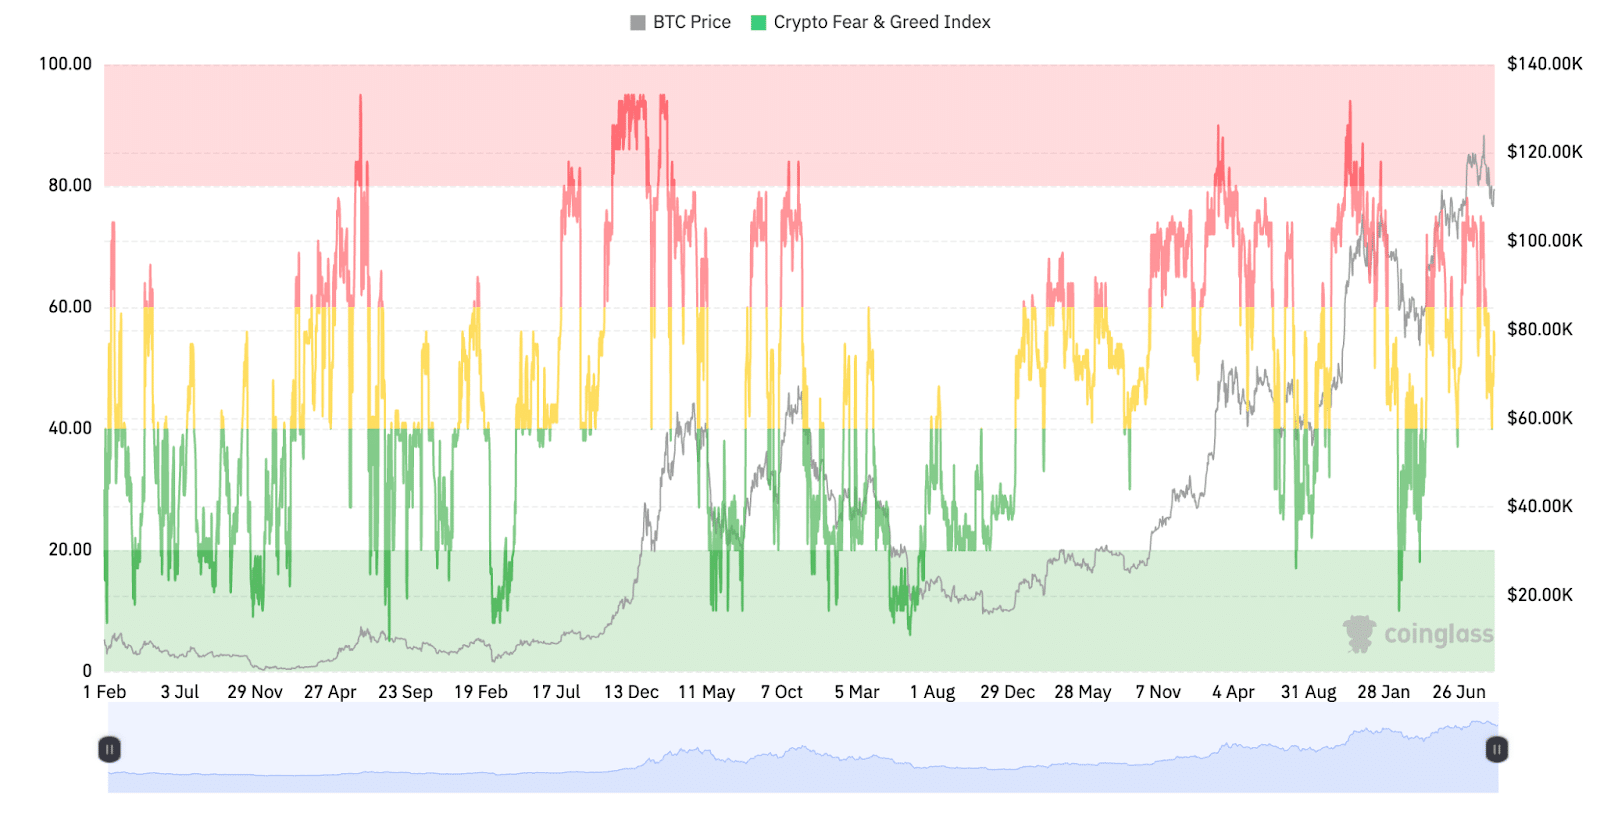
(Source: BTC Fear and Greed Index – Coinglass)
A sign of mild greed shows that buyers are still active. But if momentum slows, the chance of a pullback grows.
For Bitcoin, that could mean more volatility around current levels. Traders are watching closely to see if the move toward greed brings a cooling phase before any push higher.
Charts shared by Wedson on X show that BTC/USD is moving in line with past cycle patterns.
Still, this cycle carries key differences. One of the biggest is the strong role of institutional investors and Bitcoin’s growing status as a macro asset.
EXPLORE: Gemini IPO Targets $317M as Trump Media Bets $1B on Crypto.com Treasury Strategy
Join The 99Bitcoins News Discord Here For The Latest Market Updates
Why you can trust 99Bitcoins
Established in 2013, 99Bitcoin’s team members have been crypto experts since Bitcoin’s Early days.
Weekly Research
100k+Monthly readers
Expert contributors
2000+Crypto Projects Reviewed