






BTC USD price prediction shows the asset changing hands at $62,800, down -1.4% over the past 24 hours, according to Binance data pulled moments ago. That’s a notably softer print than the $63,791 level cited in recent market commentary, and it puts the coin uncomfortably close to a line in the sand that chart watchers have been flagging all week. Whether that line holds may decide the next few thousand dollars of price action.
Analysts argue that today’s attempt to break higher failed to gain real traction, a pattern consistent with a broader bear market in which rally attempts tend to fizzle rather than confirm a bull market.
The immediate support band sits at $62,886 to $63,775, an area now being tested directly given the current $62,907 print. A confirmed break below the August low of $62,220 would weaken the case for any rebound toward $69,000–$72,000.
Broader crypto sentiment remains mixed. Multiple technical models call the setup outright bearish, citing a Fear & Greed Index reading of just 29, deep in “fear” territory. Against that backdrop, the question isn’t just where Bitcoin goes next, but which assets might offer asymmetric upside while the majors chop sideways.
BTC USD Price Prediction: Can Bitcoin Hit $69,000 This Week?
$BTC is now moving towards its $62,000-$62,500 support zone.
This needs to hold, or else Bitcoin will drop to $60,000. pic.twitter.com/Y1er7zhub4
— Ted (@TedPillows) August 14, 2026
At $62,800 and down -1.6% on the day, Bitcoin is sitting almost exactly inside the tight support zone analysts have been watching ($62,886–$63,775), with resistance overhead at $64,470, a swing high from Tuesday that has held firm so far. CoinLore’s broader 24-hour range puts support at $62,238 and resistance at $65,059, roughly bracketing the same zone.
Bull case: A confirmed close above $64,470 would be the first real signal that a short-term low is in, opening a path toward the $69,000–$72,000 corrective target.
Base case: Continued chop between $62,886 and $64,470, consistent with the consolidation pattern seen over the past 48 hours.
Bear case: A confirmed break below $62,220, the August low, would invalidate the rebound thesis and push focus to lower support levels, meaningfully reducing odds of reaching $69K.
For a deeper breakdown of that upside scenario, see this key-levels analysis. Traders parsing these levels might also want to weigh in institutional flows; recent ETF inflow data adds useful context on demand-side pressure.
Check out the BTC Markets on Kalshi and Claim Your FREE $25
Maxi Doge Targets Early Mover Upside as Bitcoin Tests Key Levels
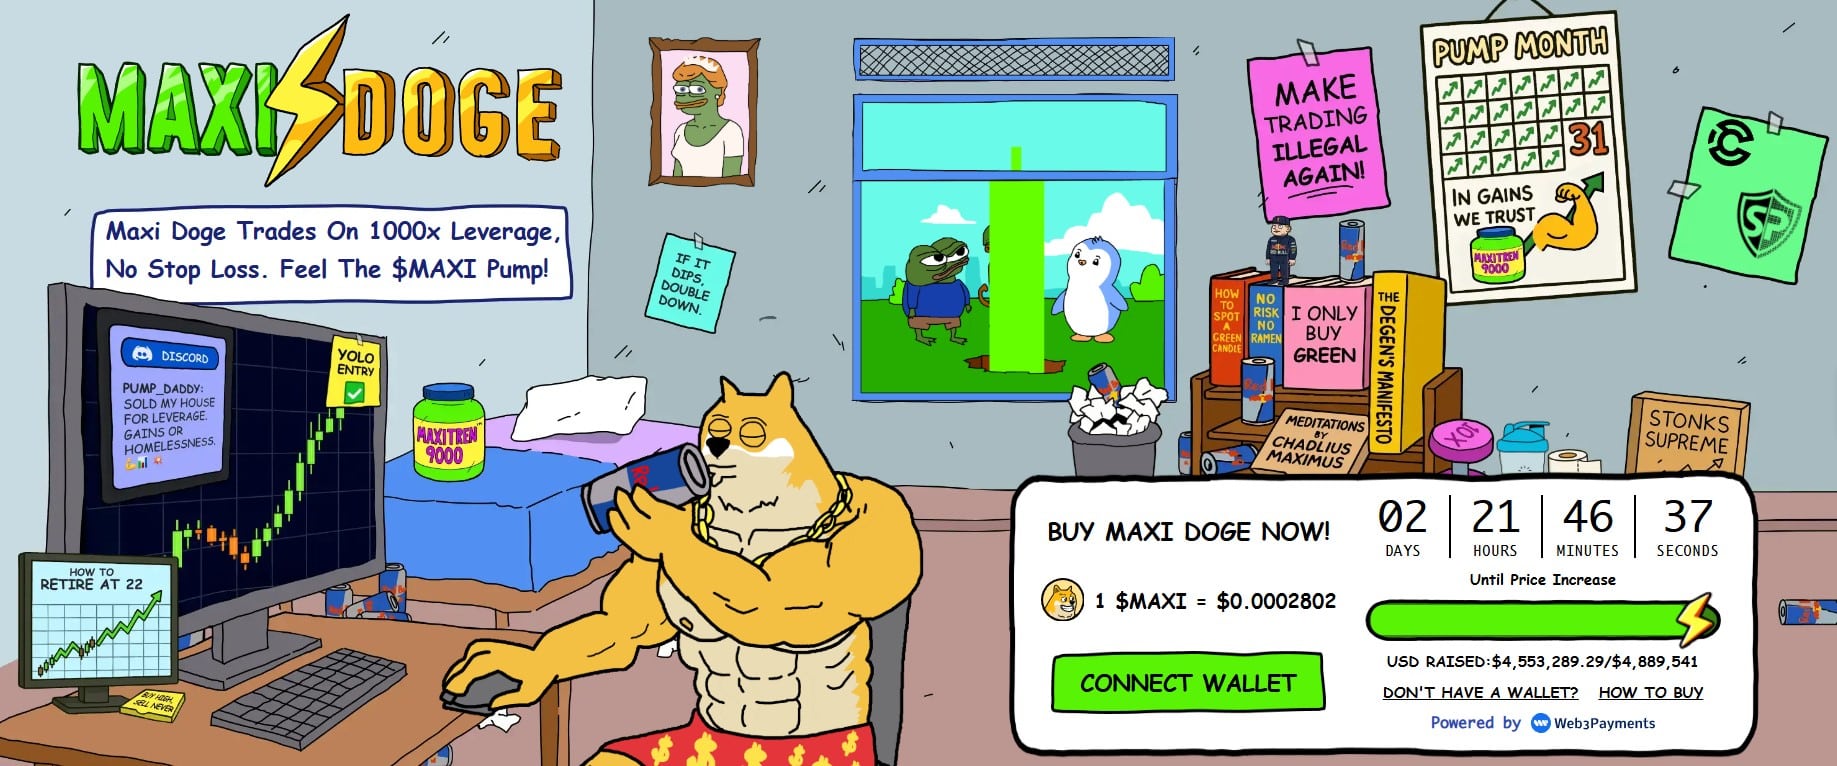
A Bitcoin stuck defending $62,886 with a Fear & Greed score of 29 isn’t exactly a screaming buy signal for risk-tolerant traders looking for near-term fireworks.
Fragile bounce attempts within a broader downtrend tend to cap upside at the large-cap level, which is precisely why some traders are rotating a slice of capital toward earlier-stage plays before the next leg, whichever direction it breaks in.
That’s the pitch behind Maxi Doge ($MAXI), a meme token built around a 240-lb canine mascot channeling “1000x leverage” trading energy, gym-bro humor included.
The presale has raised $4,844,175.14 so far, with tokens priced at $0.0002833 on Ethereum’s ERC-20 standard. Staking offers a dynamic APY, and the project’s standout feature is its holder-only trading competitions with leaderboard rewards, backed by a “Maxi Fund” treasury for liquidity and partnerships.
DISCOVER: Next Possible 1000x Crypto in 2026
Follow 99Bitcoins on X (Twitter) For the Latest Market Updates, and Subscribe on YouTube For Daily Expert Market Analysis.

Why you can trust 99Bitcoins
Established in 2013, 99Bitcoin’s team members have been crypto experts since Bitcoin’s Early days.
Weekly Research
100k+Monthly readers
Expert contributors
2000+Crypto Projects Reviewed