No Comments
This is the weekly Bitcoin Price report for the week of September 7-September 13, 2014. This report provides a quick overview of the daily opening prices on the Bitstamp Bitcoin exchange, a more detailed description of the daily price activity, and a general forecast for the Bitcoin price in the coming week. This week was a slightly bearish one, but overall the week was relatively calm, with the Bitcoin price remaining between $470 and $480, falling a total of 0.83% for the week.
Quick Overview of the Daily Bitcoin Price
Note: The prices on this list have been rounded to the nearest dollar amount. Therefore, our description of the Bitcoin price movements for the week will not be 100% accurate.
- Sep 7: $480
- Sep 8: $471 (-1.88%)
- Sep 9: $467 (-0.85%)
- Sep 10: $474 (+1.45%)
- Sep 11: $480 (+1.27%)
- Sep 12: $475 (-1.04%)
- Sep 13: Open: $470 (-1.05%) Close: $476 (+1.28%)
- Weekly change: -0.83%
Weekly Bitcoin Price Recap
September 7
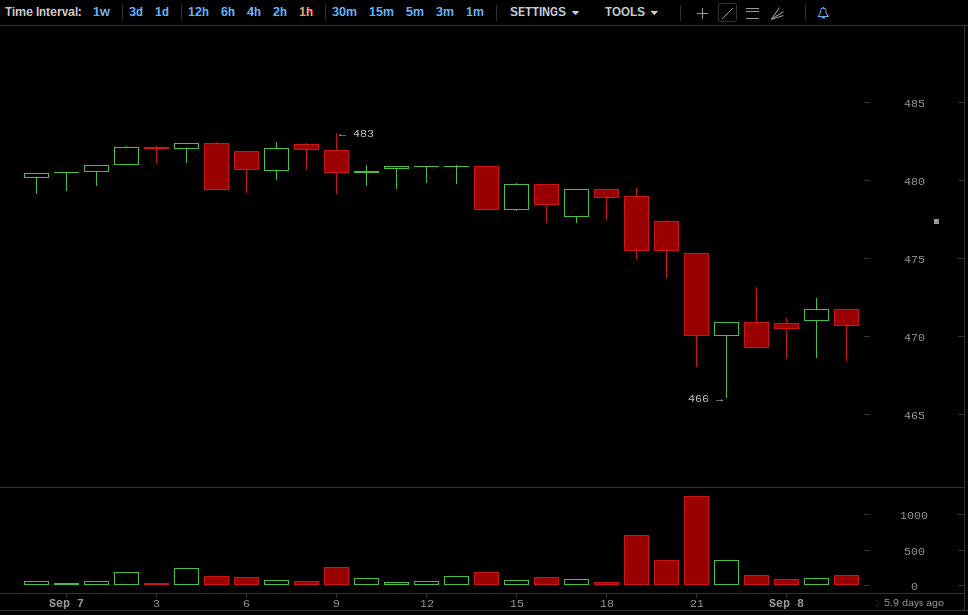
The week began on September 7, 2014, with the Bitcoin price at $480. Most of the day was relatively flat in terms of price activity, staying between the high $470s and the low $480s. However, the price took a downward turn towards the end of the day; at 7 PM, the price fell from $479 to $476, and continued moving downward until 10 PM, where it leveled out in the high $460s to low $470s range. The day closed out at $471.
September 8
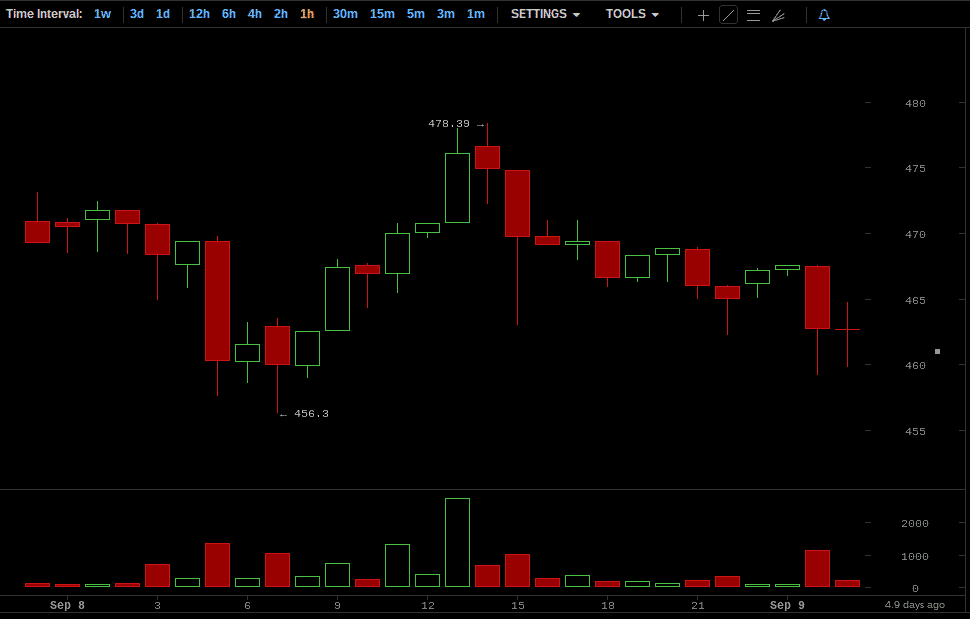
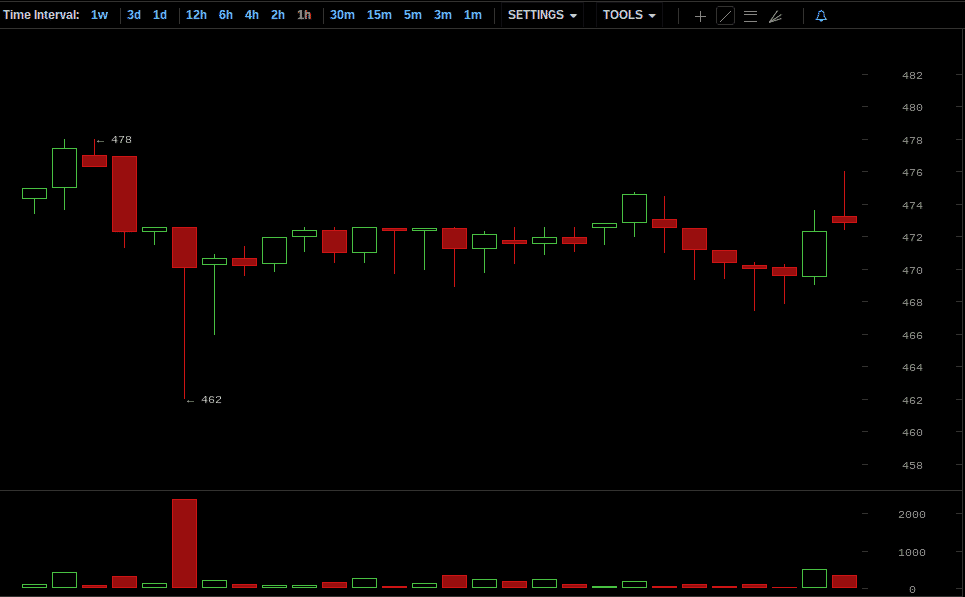
Monday, the 8th of September, opened at $471, 1.88% down from the open on Sunday, the 7th. The Bitcoin price declined gradually for the first few hours of the morning. Then, at 5 AM, the price took a sharp turn downward. The hour opened at $469, and fell to $460 by the close, with an hourly low of $457. The price began climbing at 8 AM, however, reaching $476 by 1 PM. After peaking at $478 during the 2 PM hour, the price fell into the high-to-mid $460s and stayed there for the rest of the day. September 8 ended at $467.
September 9
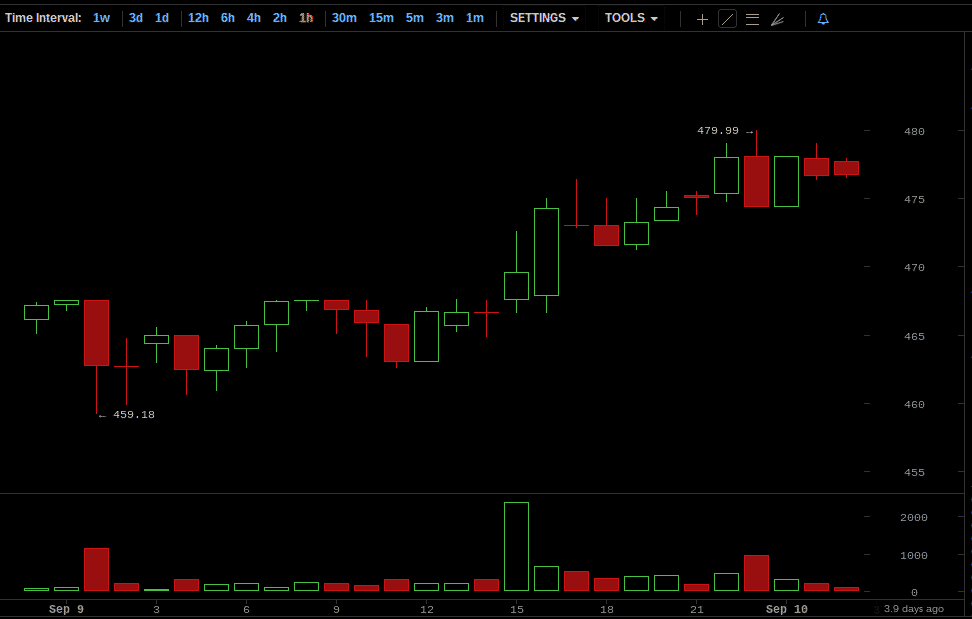
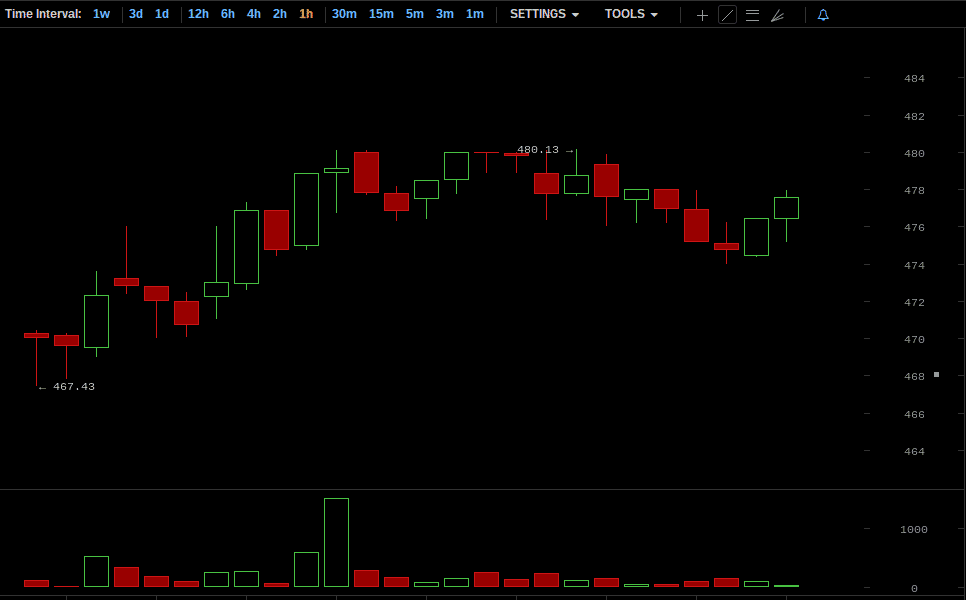
September 9 began at $467, down 0.85% from the start of the previous day. This day was characterized by gradual but steady Bitcoin price gains. The price peaked at 11 PM, at its hourly high of $479.99. Then, the day closed out at $474, marking an overall gain of $7.
September 10
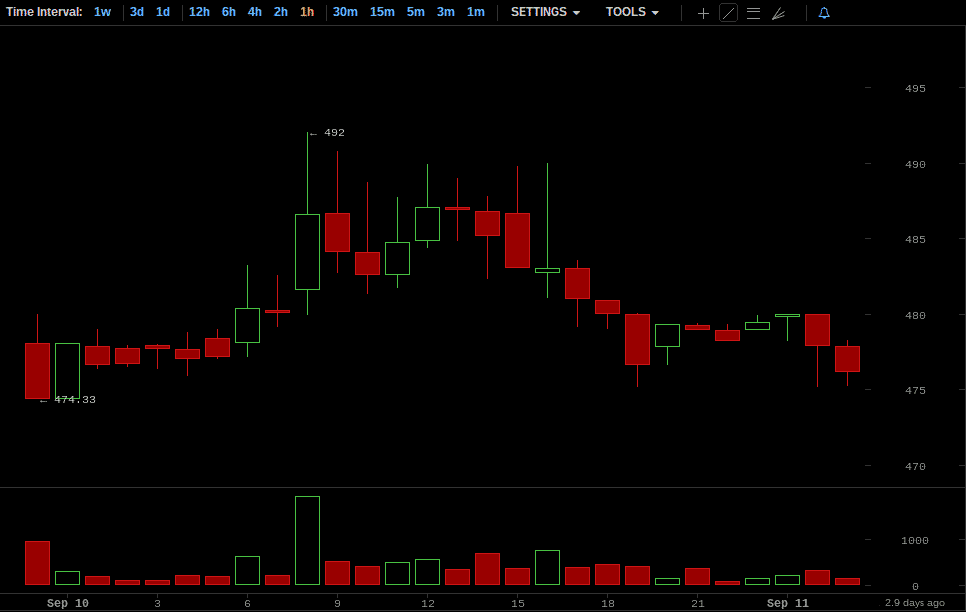
Wednesday, September 10 opened at $474, marking a 1.45% gain since the opening of September 9. The first few hours of the day saw a steady incline, reaching $486 by the close of 8 AM, with an hourly peak of $492. The Bitcoin price activity flattened out after 8 AM, though, and hovered between the mid $480s and the high $470s. The day closed at $480.
September 11
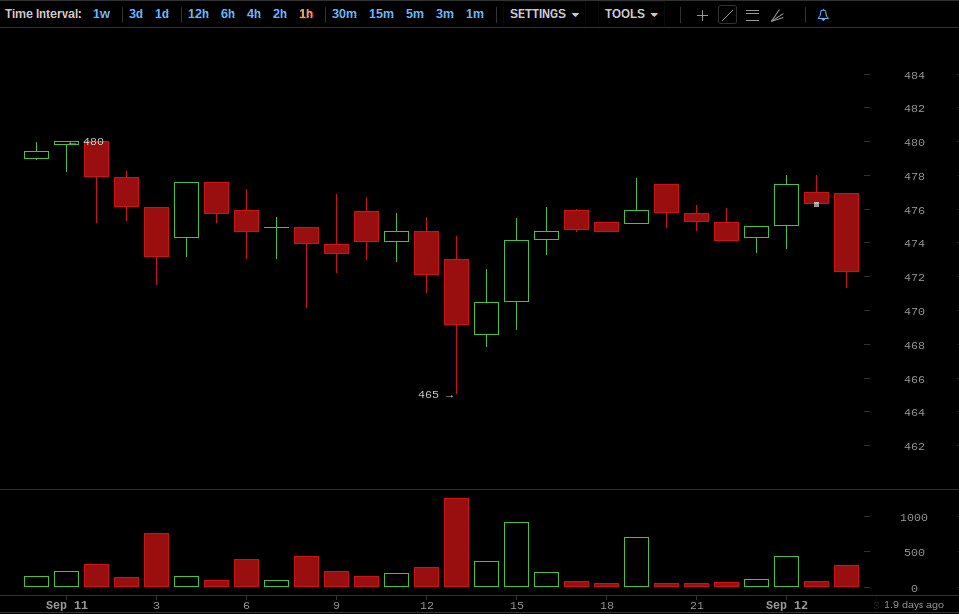
September 11 started out at $480, up 1.27% from the beginning of the previous day. Around 1 PM, the Bitcoin price took a rather quick drop from $473 to $469, with an hourly low of $465. Aside from that quick drop, the price stayed relatively flat for the entire day, remaining in the $470s. The day ended with the Bitcoin price standing at 475.
September 12
The 12th began at $475, which is 1.04% lower than the opening price on the 11th. Like the previous day, September 12 saw flat Bitcoin price activity. After a drop down into the low $470s in the early morning hours, the price stayed in that low $470s range for the entire day. The 12th closed at $470.
September 13
Saturday, September 13 opened at $470, down 1.05% from Friday. The morning saw steady Bitcoin price growth, reaching $480 by 10 AM. Heading into the afternoon, the price leveled out in the high $470s–occasionally hitting $480. The day closed, thus ending the week, at $480, a 1.28% increase from the start of the day.
Where will the Bitcoin Price go from Here?
Last week we advanced two possibilities for our ceteris paribus (all things remaining equal) forecast, due to the lack of a clearly defined trend. Our first possibility held that the Bitcoin price would remain fairly level–hovering in the low-to-mid $470s and the $480s. The second possibility we put forth was that the price would continue to gradually decline. Clearly, the former scenario ended up playing out in reality, with the Bitcoin price staying between $470 and $480, except for some short lived dips into the mid-to-high $460s.
As for the coming week, we will say that, ceteris paribus, the Bitcoin price will continue this sideways movement, staying between the $470s and the $480s. However, any unforeseen events could take place, throwing the Bitcoin price in either direction. Only time will tell what the coming week will bring in the Bitcoin world.