Bitcoin dominance is the definitive metric for measuring the relative strength of the world’s first and largest cryptocurrency against the broader digital asset market. As the primary “compass” for crypto sentiment, this ratio indicates whether capital is flowing into the relative safety of Bitcoin or rotating into higher-risk altcoins like Ethereum, Solana, Cardano, etc.
Understanding this balance is important for those looking to time market cycles and protecting crypto portfolios from volatility. Our live chart and comprehensive wiki explain how to calculate this metric, interpret historical trends, and use dominance signals to identify the start of the next “altcoin season.”
Bitcoin Dominance Live Chart:
![]() Bitcoin Dominance Chart
Bitcoin Dominance Chart
The TL;DR: What is Bitcoin Dominance?
Key Takeaways on BTC Dominance
- Bitcoin dominance refers to the percentage of the total cryptocurrency market cap represented by Bitcoin.
- A high Bitcoin dominance indicates that investors are seeking safe-haven assets and are more risk-averse, while a low dominance suggests that investors are more willing to take on risk and invest in alternative cryptocurrencies.
- Moving averages, trend lines, and support and resistance levels can be used to analyze Bitcoin dominance and identify trends.
- Trading volume also provides an effective indicator of changes in BTC market dominance, with decreasing volume potentially indicating a trend reversal.
- When considering portfolio allocations, monitor long-term trends, including BTC.D, and be prepared for volatility.
Bitcoin dominance is the percentage of the total cryptocurrency market capitalization represented by Bitcoin. For example, if the total crypto market cap is $3 trillion and Bitcoin’s market cap is $1.5 trillion, then BTC dominance is 50%. This widely used metric measures Bitcoin’s market size relative to the rest of the cryptocurrency market.
Fortunately, the math is straightforward. To calculate Bitcoin dominance, we divide Bitcoin’s market cap by the total market cap of all cryptocurrencies and multiply by 100.
For example, if Bitcoin’s market cap is $2.4 trillion and the total cryptocurrency market cap is $4 trillion, we calculate Bitcoin dominance as 60%. This means Bitcoin accounts for approximately two-thirds of the total cryptocurrency market cap.
We could express this as:
- $2.4 trillion ÷ $4 trillion x 100 = 60
Many chart tools, such as our own and TradingView, show BTC.D as a percentage, removing the need for hand calculations.
Now that we know how to calculate Bitcoin market dominance, let’s examine the role it plays in broader crypto markets.
BTC Dominance Over the Years
Historical trends offer insight into the significance of Bitcoin dominance. The long-term Bitcoin dominance chart also makes it easy to spot when other projects started to gain meaningful market interest.
First, let’s examine the all-time highs, lows, as well as all-time low levels.
- BTC.D all-time high (early crypto market): ~100%
- Mature market all-time high: ~74%
- BTC.D all-time low: ~35%
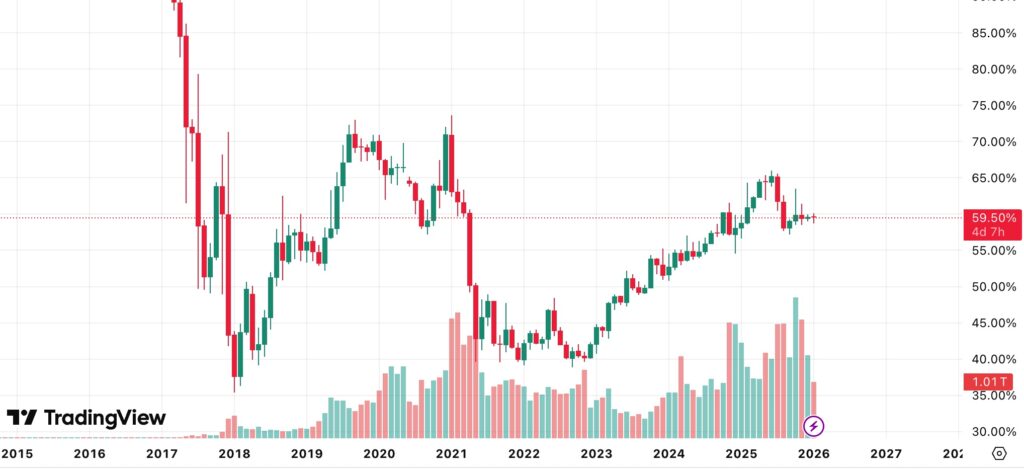
Over the past two years, Bitcoin dominance has undergone a notable structural shift, climbing from the low 50% range in early 2024 to a multi-year peak near 60% by early 2025. This ascent was primarily fueled by the “institutionalization” of the asset, kicked off by the landmark approval of U.S. spot Bitcoin ETFs. Unlike previous cycles, when capital quickly rotated into high-risk altcoins, this period saw a sustained “flight to quality,” with all eyes and interest focused on Bitcoin. Institutional investors and corporate treasuries treated Bitcoin as the primary entry point and a “digital gold” hedge, keeping liquidity concentrated in BTC and leaving many altcoins struggling to keep pace despite the broader market’s growth.
As we moved through late 2025 and into early 2026, the dominance metric began to stabilize in a high-level consolidation zone between 55% and 60%. While we have seen a slight retraction from the 2025 highs, driven by the emergence of altcoin ETFs (particularly for Ethereum and Solana) and a surge in stablecoin dominance, Bitcoin remains remarkably resilient compared to previous cycles. Notably, the “Altseason” of early 2026 has been more surgical and narrative-driven than the speculative manias of 2017 or 2021. This suggests a maturing market where Bitcoin’s role as the “anchor tenant” of the crypto ecosystem is more solidified than ever, effectively setting a higher “floor” for its dominance than in years past.
Bitcoin Dominance Observations in Recent History
-
2-Year High: Approximately 60-61% (reached in early 2025).
-
2-Year Low: Approximately 50-51% (seen in early 2024).
-
Notable Trend: The failure of dominance to drop below 40% (a historical “Altseason” indicator) suggests that institutional holding patterns have fundamentally changed the market’s rotational dynamics.
Why Does Bitcoin Dominance Matter? (Impact on Altcoin Season)
Understanding Bitcoin dominance (BTC.D) isn’t just for market analysts with too many monitors who trade technical analysis all day; it’s the most practical tool you have for knowing when to hold your “boring” Bitcoin and when to let your altcoin bags fly. This is where Altcoin Season comes into play.
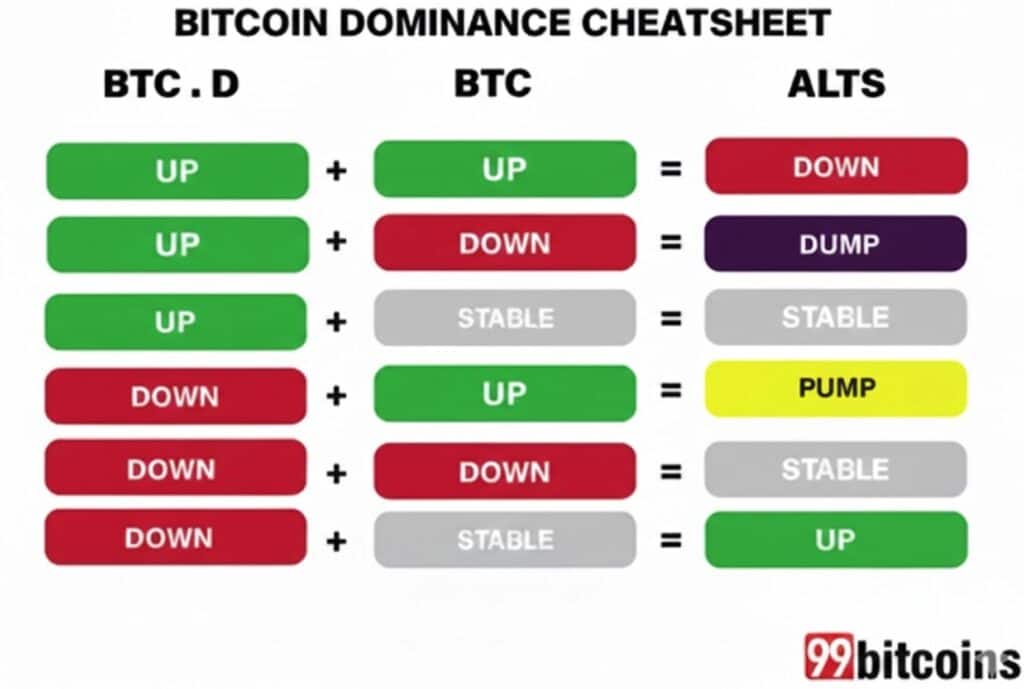
The “Cheat Sheet” for Market Cycles
Think of Bitcoin as the sun in our solar system. When it moves, gravity changes for everything else. Here is how to read the room. When:
BTC Dominance Up + BTC Price Up: Bitcoin is King. Capital is flowing into the safest, most liquid asset in the space. Stay out of the way of the train; trying to pick “winners” in the altcoin market here is usually a recipe for underperformance. History shows that, over the course of most crypto cycles, Bitcoin outperforms the vast majority of altcoins. While many altcoins will experience violent spikes and outperform Bitcoin over a very short time frame (think days to weeks), history has proven that BTC will likely outperform.
BTC Dominance Down + BTC Price Sideways: The “Altseason” Sweet Spot. This is the Goldilocks zone. Bitcoin is stable, investors are bored, and they start moving profits down the risk curve. This is when your random bag of tokens might actually do something. This is the period of time you want to familiarize yourself with altcoin season trading strategies if you want to get involved in the chaos that is altseason.
BTC Dominance Down + BTC Price Down: The Exit Ramp. Everything is on fire. This usually indicates a total market flush where capital is exiting the crypto ecosystem entirely for cash. Grab a coffee, stay calm, and wait for the dust to settle. Bitcoin is often considered the safest crypto asset during these periods as most altcoins can lose 90% or more of their value, while Bitcoin dips are often in the 30-40% range.
Common Pitfalls
Even with the best charts, people still manage to trip over their own feet. Here’s why the “Dominance” metric is often misunderstood:
The “Return to 100%” Myth: Thinking 100% dominance is ever coming back is like thinking we’ll go back to using only one website for the entire internet. The ecosystem is too big now. Spoiler: It’s not happening.
The Ethereum “Chunk”: People often forget that Ethereum (and increasingly Solana) owns a massive, structural slice of the pizza. If ETH pumps, BTC dominance drops, but that doesn’t necessarily mean your low-cap micro-gems are going to follow suit.
The Math Trap: Never forget that “Dominance” is a math equation, not a crystal ball. It measures relative market caps, not necessarily “value” or “utility.” If a trillion new “scam-coins” are minted tomorrow, BTC dominance will drop on paper, even if Bitcoin is doing just fine.
Bitcoin Dominance FAQs
What is a good Bitcoin dominance level for Altseason?

A classic “Altseason” is typically triggered when Bitcoin dominance falls below 50% to 55% while the price of Bitcoin remains relatively stable, signaling that capital is rotating out of the “king” and into riskier assets.
Does Bitcoin dominance affect price?
Bitcoin dominance doesn’t directly drive price action, but acts as a barometer for capital rotation, signaling whether investors are seeking the safety of Bitcoin or the high-risk potential of altcoins.
Why you can trust 99Bitcoins
Established in 2013, 99Bitcoin’s team members have been crypto experts since Bitcoin’s Early days.
Weekly Research
100k+Monthly readers
Expert contributors
2000+Crypto Projects Reviewed