In This Article
- Markets Flip Bullish Amid Successful Consolidation: Open Interest Surges Ahead of Next All-Time High?
- Is Bullish Sentiment in Derivatives Markets Reflected in Bitcoin On-Chain Exchange Outflows?
- Bitcoin Spot ETF Inflows and Veterans Hodling Strong But Bitcoin Miners Selling Into Strength
- The Key Question: Is The Bitcoin Cycle Top Here Yet? Or, Will Nvidia GTC 2024 Flip BTC Parabolic?
- Bitcoin On-chain - The Bottom Line: Nvidia GTC 2024 Could Trigger Parabolic 2024 Bitcoin Bull Cycle
Bitcoin (BTC) is kick-starting a new week (March 18-24) trading in a well-defended consolidation above the 20 DMA, but as crypto markets brace for big moves surrounding Nvidia GTC 2024 – how are things shaping up for Bitcoin on-chain? Read on and find out in Bitcoin On-Chain Analysis with 99Bitcoins.
As markets open for the week ahead, BTC is trading in a poised posture after mounting a strong consolidation over the weekend.
This comes after Bitcoin price entered a -12% localized retracement last Friday, following a new all-time high at $73,737 on March 14, 2024.
Now trading just below resistance around $68,000, Bitcoin appears set for decisive movements as it heads into an exciting week on the market, with all eyes on the upcoming Federal Reserve FOMC meeting on Wednesday, March 20 which will see the latest decision on US interest rates announced, alongside comments from Jerome Powell.
Markets are anticipating that interest rates will remain unchanged this week despite comments from the Fed Chair stoking concern last week.
Agreed, but I'd say it's also a symptom of interest rates no longer correlating with global liquidity. High/rising interest rates had me shook.
— VNTGPRN (@VNTGPRN) March 14, 2024
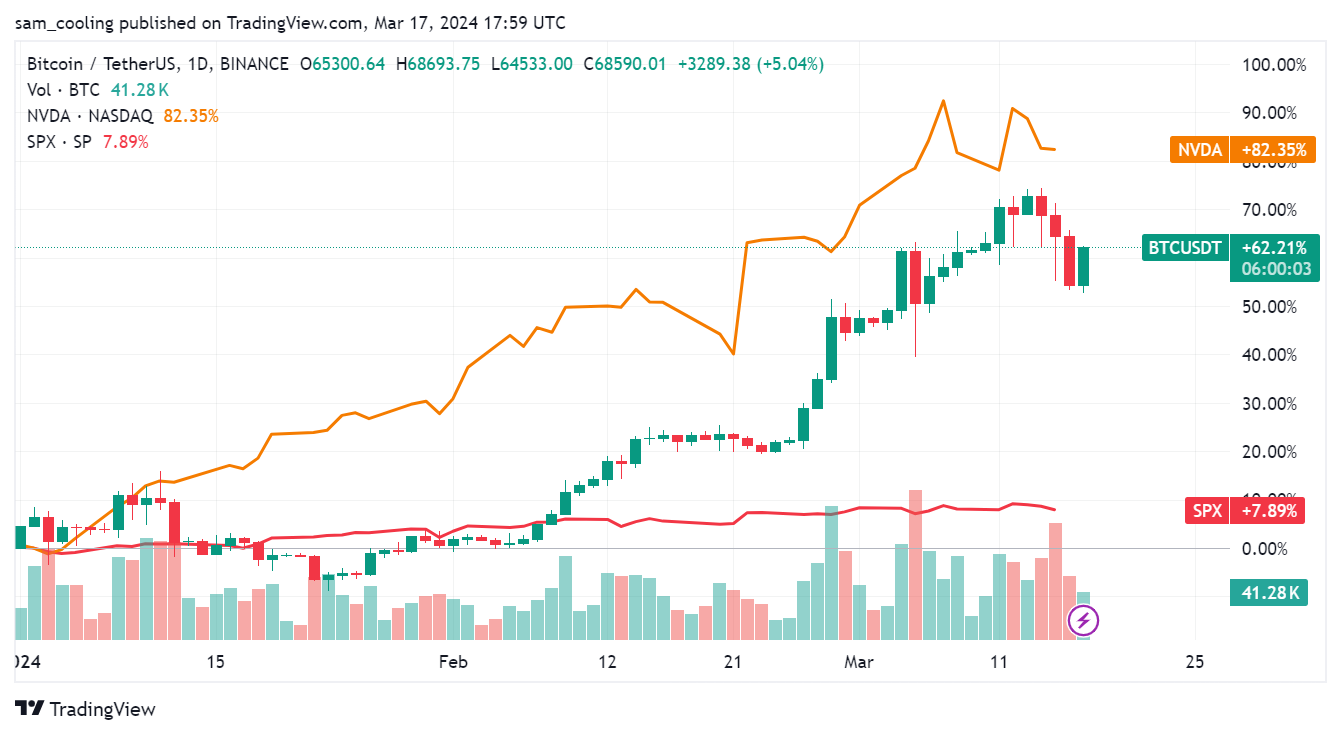
However, crypto market sentiment appears defiant as the impending decision approaches, with traders spotlighting Bitcoin’s break from correlation with US equities markets, with the top cryptocurrency instead rising dramatically alongside major AI tech stocks in recent weeks, in a rally led by GPU-manufacturer Nvidia (NVDA) as markets teem with anticipation for the Nvidia GTC 2024 conference (starting Tuesday).
https://twitter.com/opnphoenix/status/1769473385971523612
Many believe Bitcoin is now trading independently of US equities moves, reducing the potential influence of macroeconomic decision-making by the US Federal Reserve.
Indeed, BTC’s +62.21% YTD gains have correlated strongly with NVDA’s +82.35% YTD performance, while the S&P500 has remained at slow growth with modest +7.89% YTD gains.
Yet, as institutional inflows play an increasingly important role in stimulating demand for 2024’s emerging bull run, uncertainty looms over how macroeconomic sentiment could influence spot Bitcoin ETF accumulation.
Current excitement surrounding the new ETF product offerings is tied heavily with wider risk-on sentiment across financial markets.
If the Federal Reserve appears to be failing to reduce inflation to 2% by breaking expectations of rates remaining unchanged, this could spook investors – kicking hopes of a rate cut into the long grass and potentially reducing the volume of institutional capital flowing into Bitcoin markets.
Markets Flip Bullish Amid Successful Consolidation: Open Interest Surges Ahead of Next All-Time High?
To get a better look at what’s going on behind the scenes in the Bitcoin market, let’s deep-dive the action on-chain and unpack how things are shaping up for the week ahead.
To start, let’s take a look at Bitcoin’s open interest, which measures the total number of unfulfilled contracts stacked up across all Bitcoin exchanges in the derivatives market.
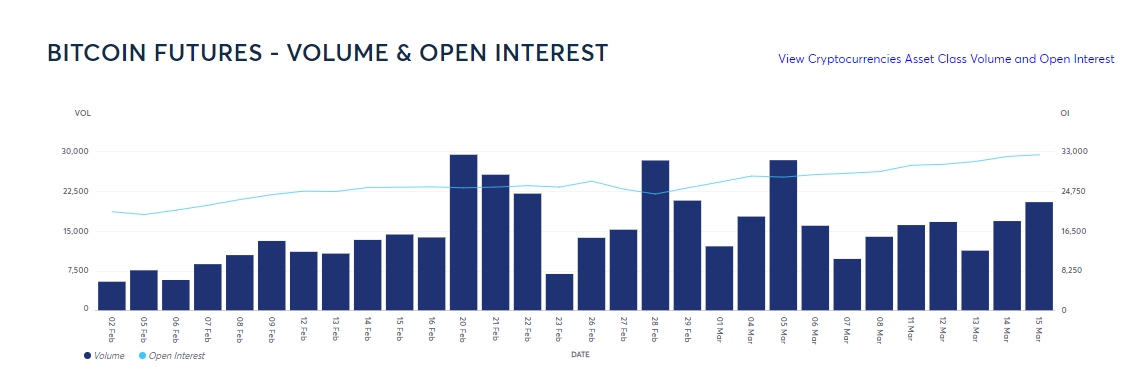
By measuring the total number of open contracts, Open interest differentiates itself from trading volume – which measures the total number of contracts traded.
Data from CME reveals that despite trading volume decreasing over the past two weeks, the number of open contracts continues to rise, with open interest increasing 1.07% over the past 24 hours to hit a whopping $35.6Bn.
A closer examination, using the long vs short ratio, which depicts the ratio of open contracts sat in taker buy positions (longs) vs taker sell positions (shorts), reveals that Bitcoin’s well-defended consolidation move has boosted trader confidence.
Over the past 24 hours, Bitcoin markets have shifted from a bearish stance at 50.5% taker sell, to a bullish posturing with more than 51% of open interests leaning long.
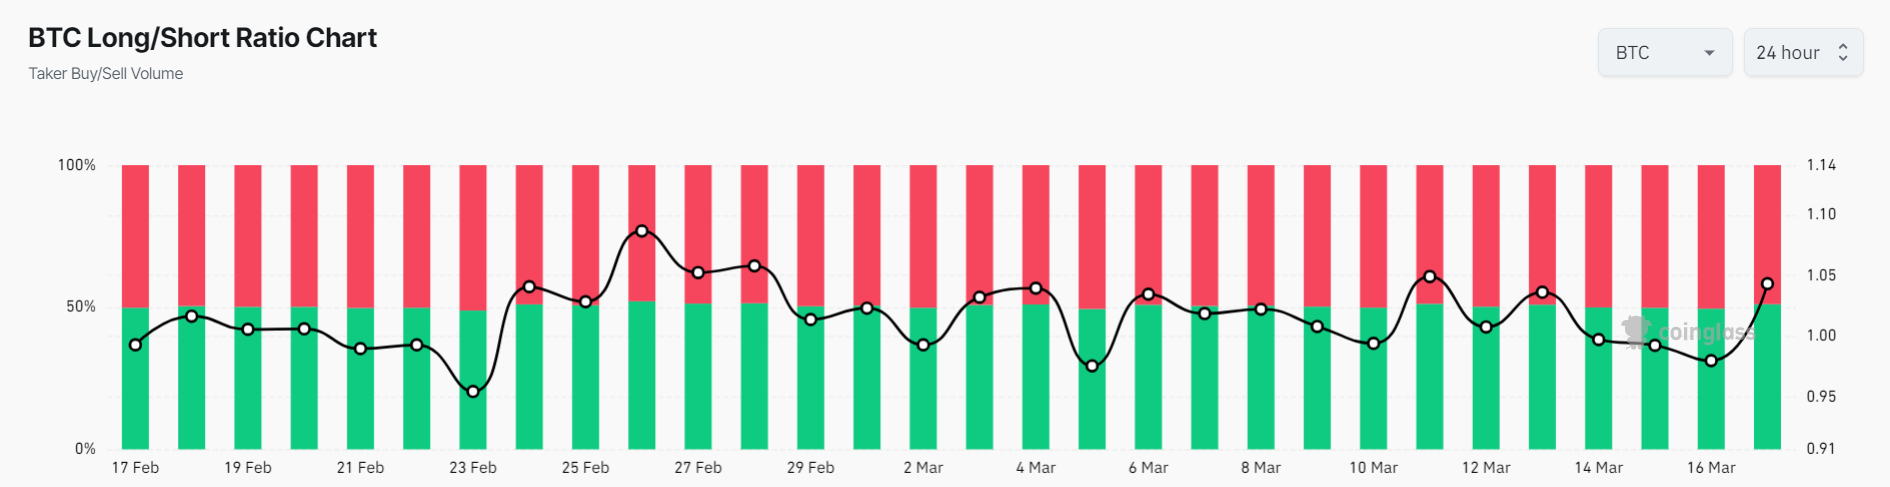
Overall then, high open interest and low trading volume reinforce the image of Bitcoin in consolidation, with buyers and sellers in relative balance as price action pushes towards a decisive move.
Is Bullish Sentiment in Derivatives Markets Reflected in Bitcoin On-Chain Exchange Outflows?
An uptick in longs heading into the week ahead, suggests market sentiment leans bullish on the short-time frame. But is this reflected in accumulation on-chain?
To find out, let’s take a look at the Exchange Net Position Change chart, which depicts the 30D change in exchange supply (across all exchanges).
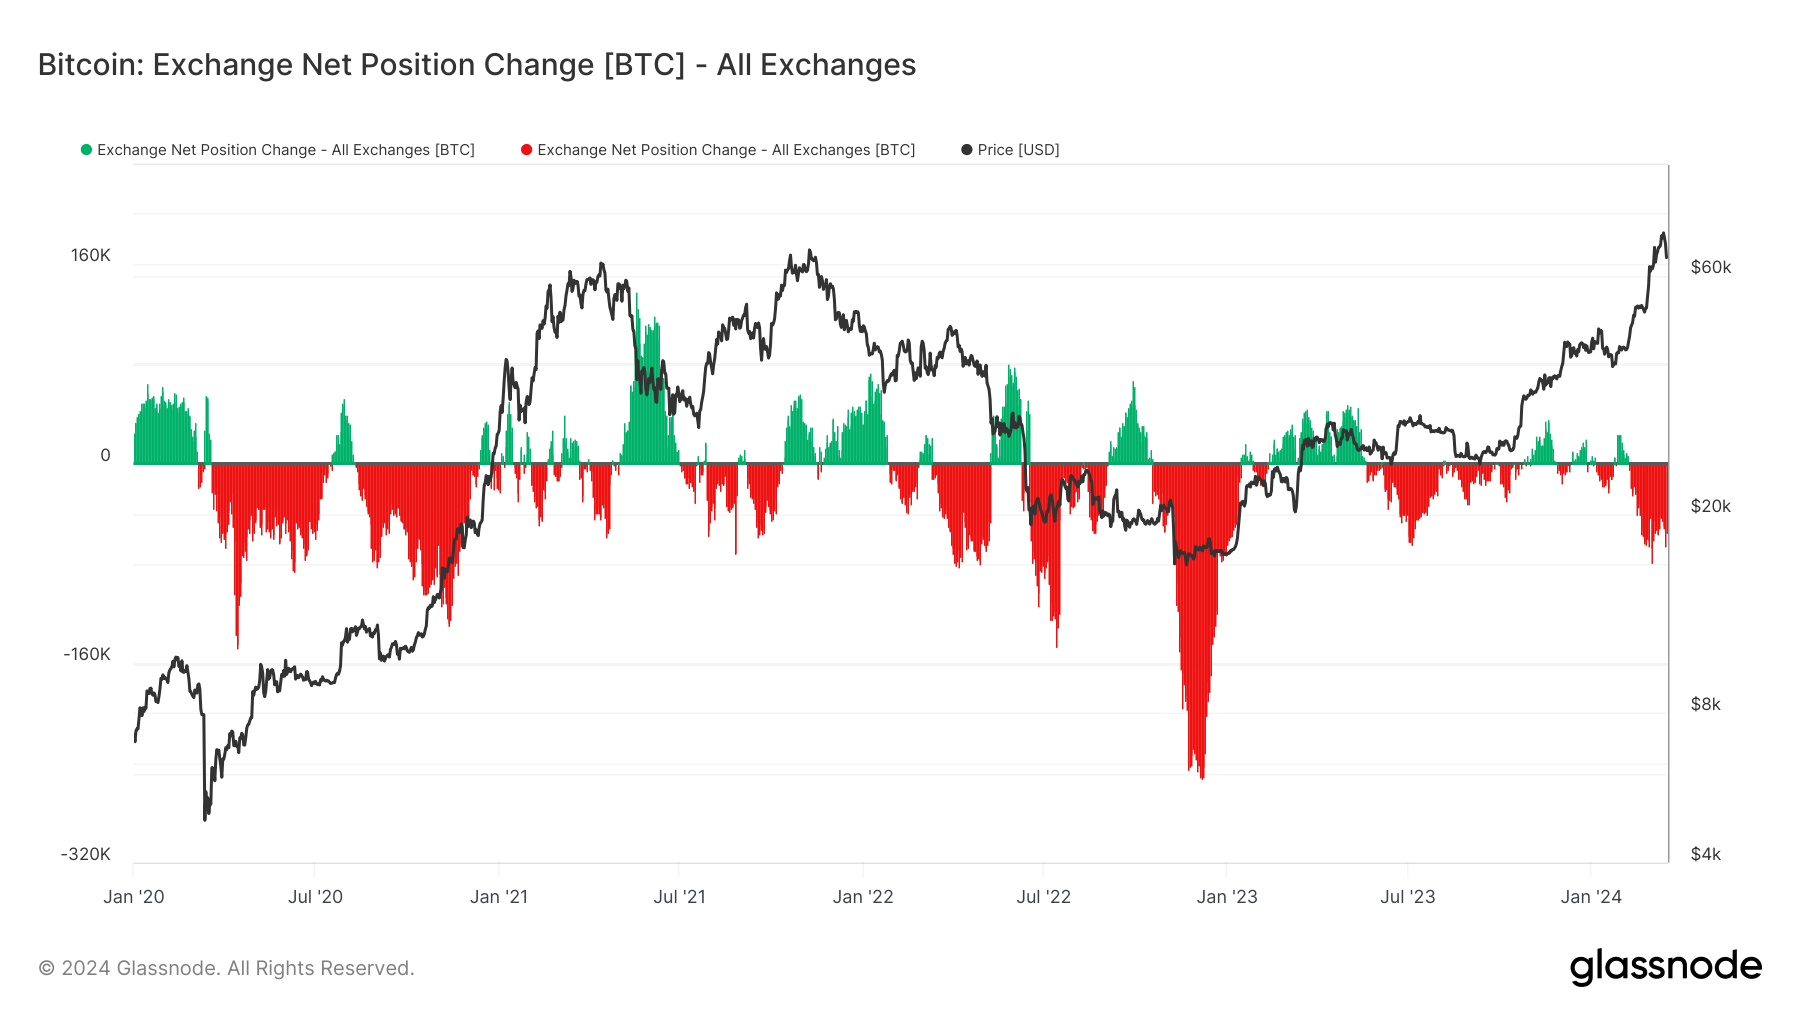
(Exchange Net Position Change)
Across the long time frame, it’s clear to see that Bitcoin markets remain in a deep period of accumulation, with strong outflows of BTC from exchanges since February 6 – now standing at -55,009 BTC over the past 30D. (Note: ETF and Microstrategy acquisitions are mostly OTC and unseen here).
The sheer strength of ongoing exchange outflows is now mirroring the accumulation windows found during 2020 in the prelude to the 2021 bull market.
Outflows of this scale have only been surpassed once before, during the panicked flight from exchanges – as holders took self-custody due to the collapse of disgraced industry giant FTX.
Meanwhile, on the short-time frame, data from Net Transfer Volume from/to Exchanges shows that despite a -12% move following the new all-time high on March 14, markets are buying the dip.
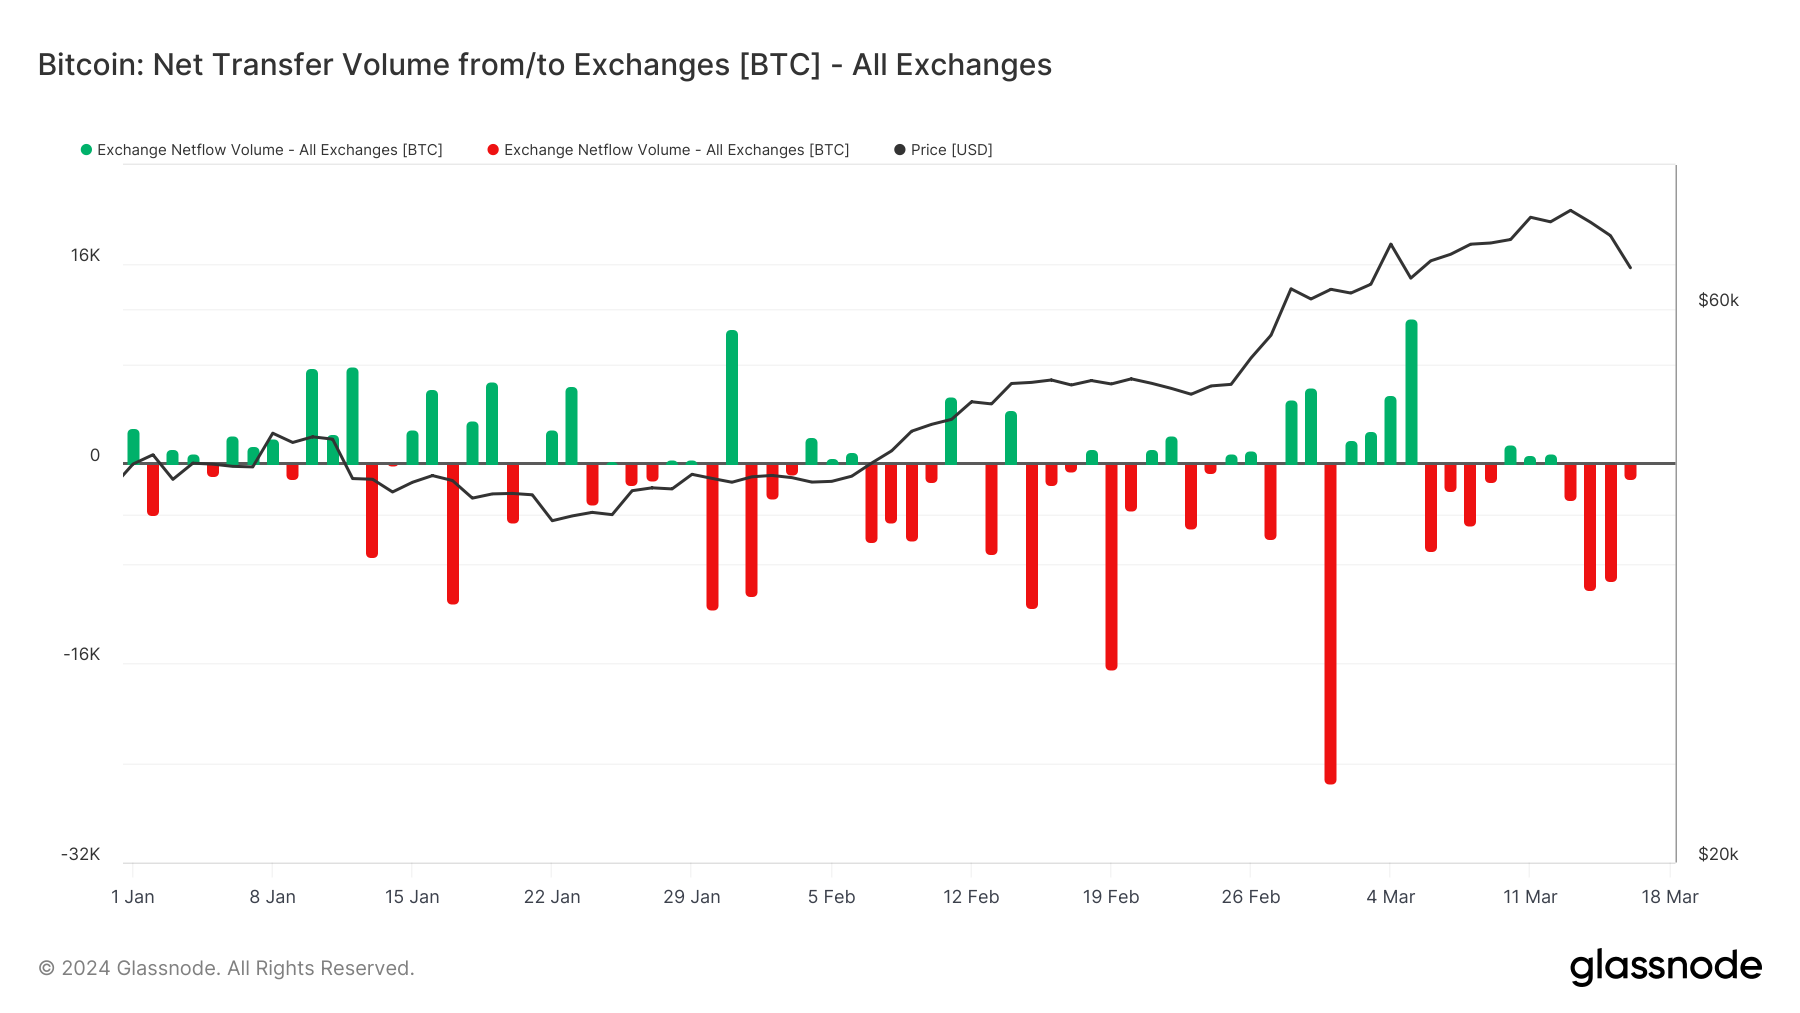
(Net Transfer Volume – Exchanges)
Over the past 3-days of retracement and consolidation, a net 20,665 BTC has been withdrawn from exchanges as buyers continue to accumulate – suggesting market appetite even at Bitcoin’s current dizzying heights.
Bitcoin Spot ETF Inflows and Veterans Hodling Strong But Bitcoin Miners Selling Into Strength
The scale of these exchange outflows becomes all the more impressive when it’s considered in relation to the shift in long-term holder behavior, which pivoted into distribution over the past 3-months.
Since December 4, 2023, the number of BTC held in the hands of long-term holders (defined as coins being held longer than 155 days) has decreased by -5%.
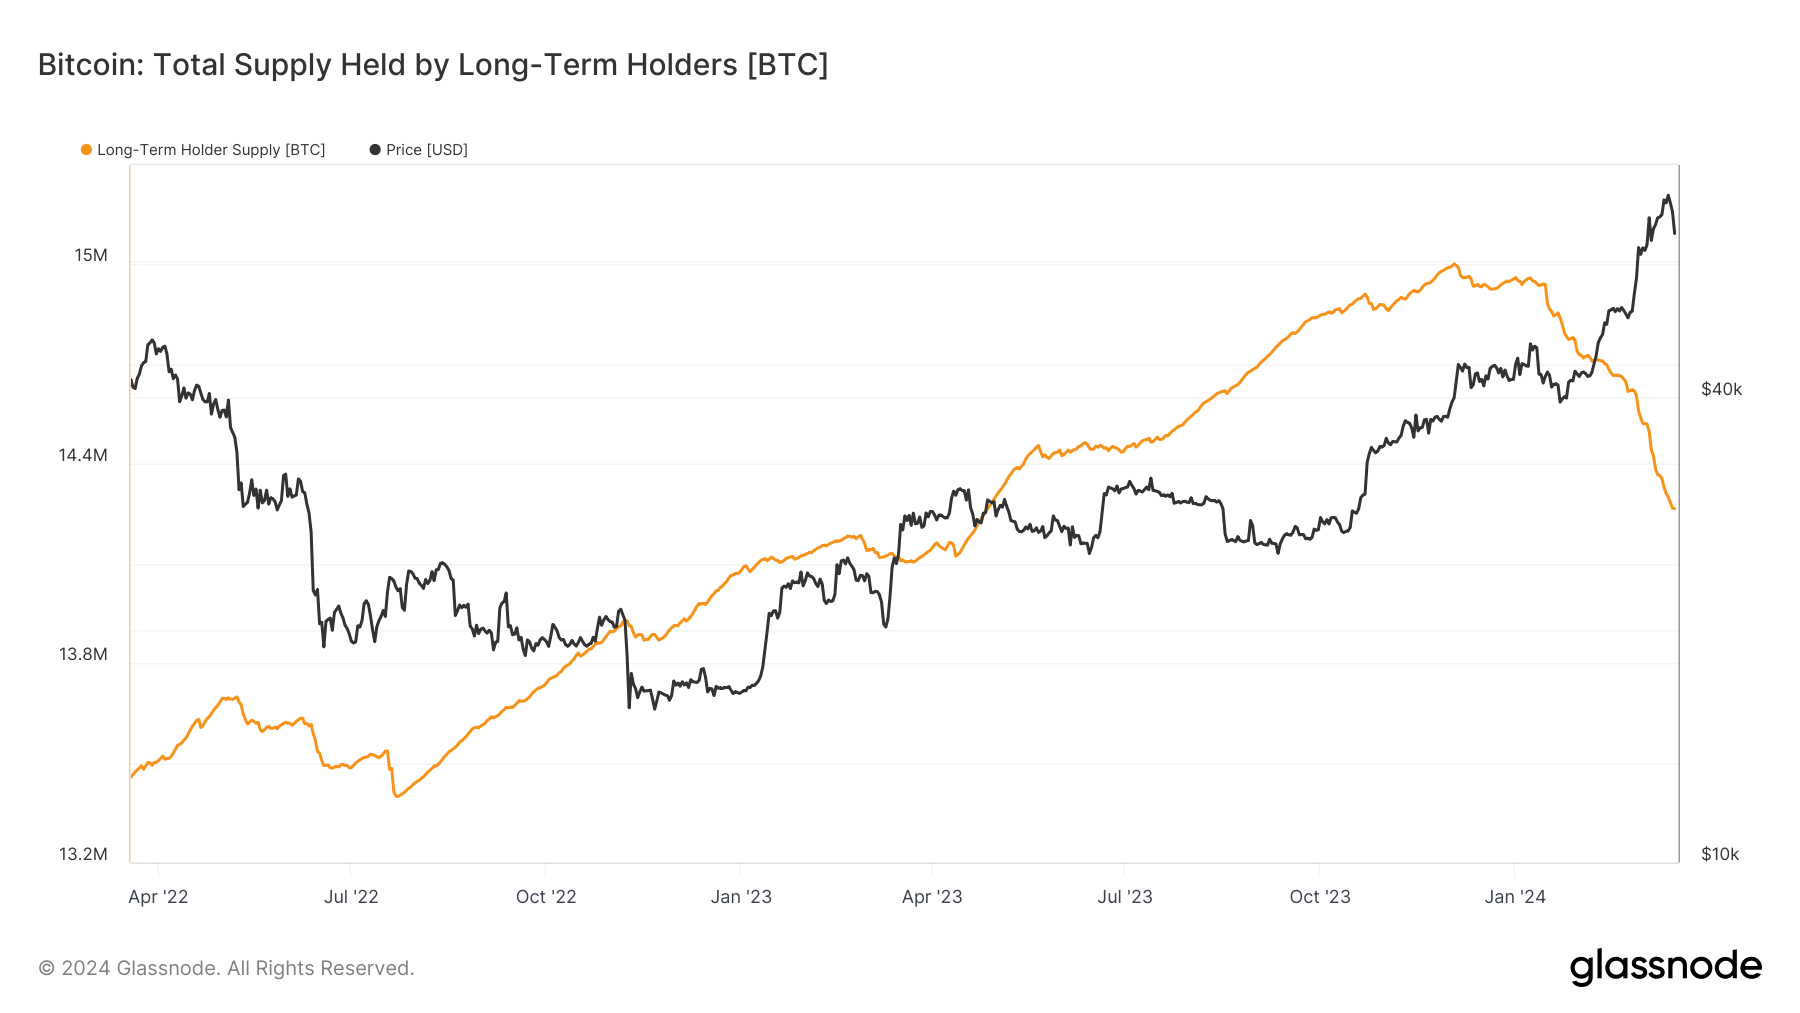
(Total Supply Held By Long-Term Holders)
To investigate where this sell-pressure is coming from, an examination of the iconic HODL waves chart reveals that true long-term holders are in accumulation.
The majority of supply currently being distributed in the market appears to be coming from coins acquired between H2 2022 and H1 2023 – suggesting a small degree of profit-taking by mid-term holders.
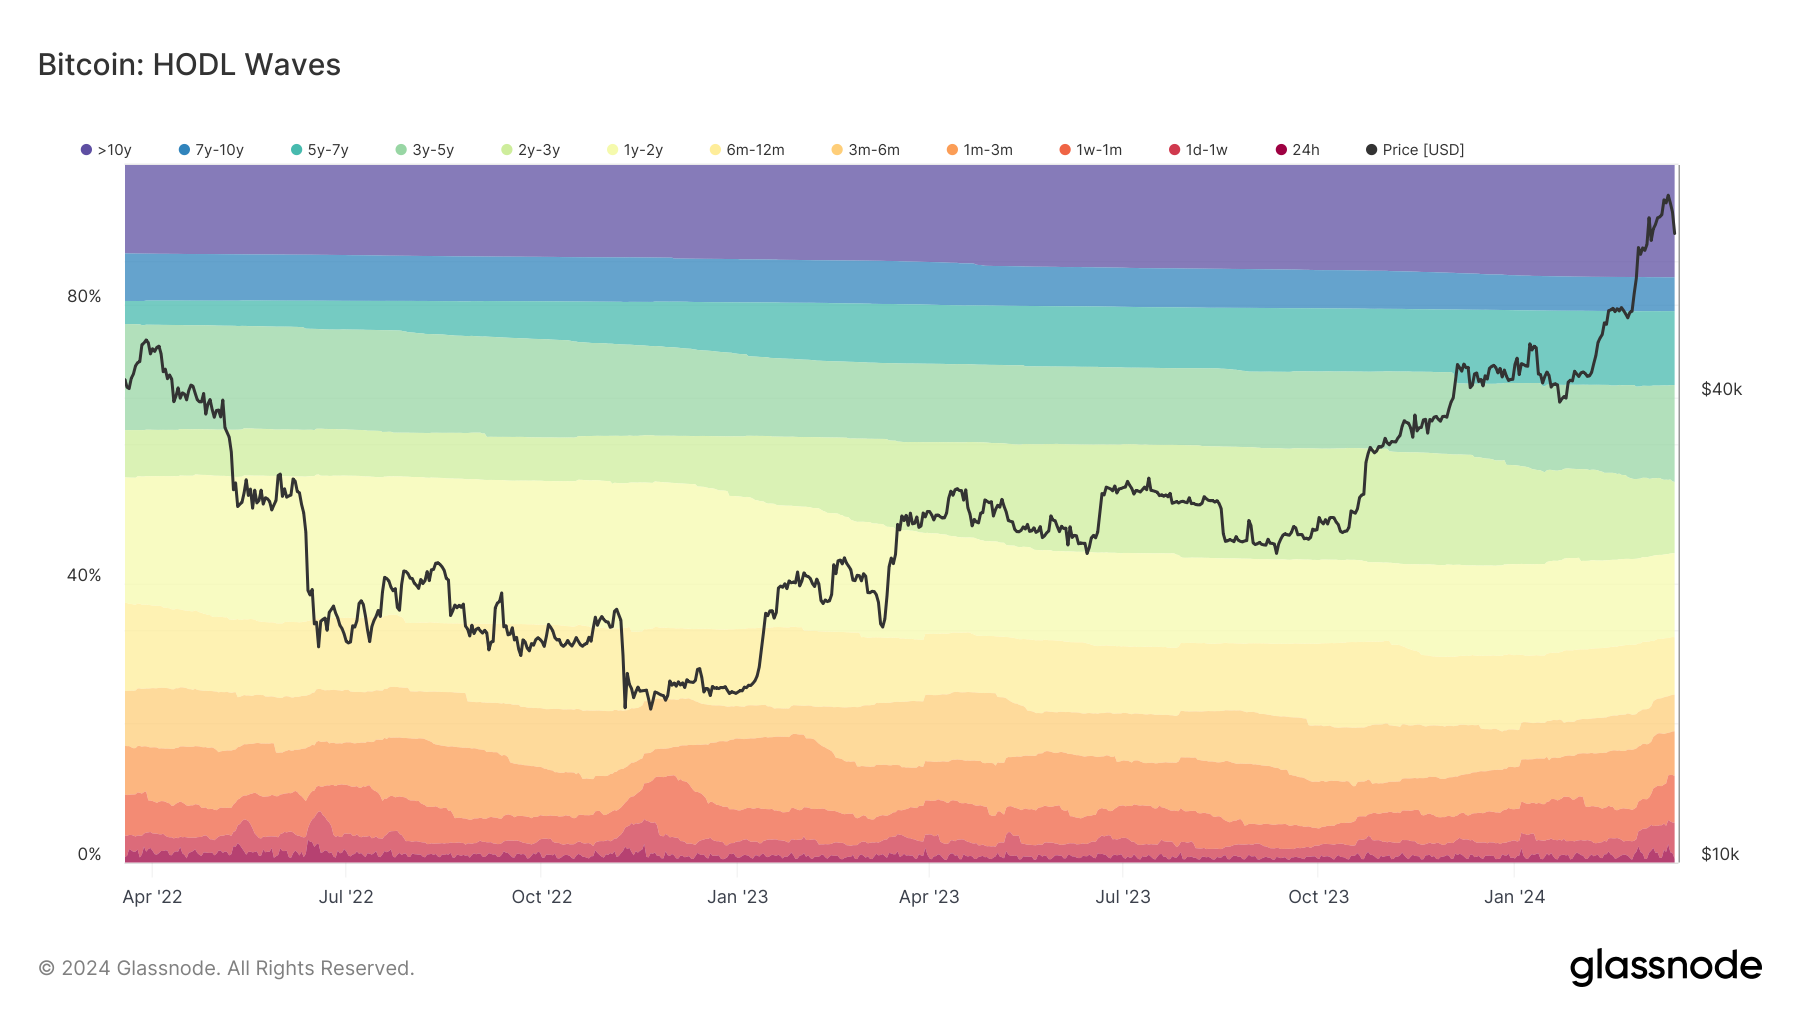
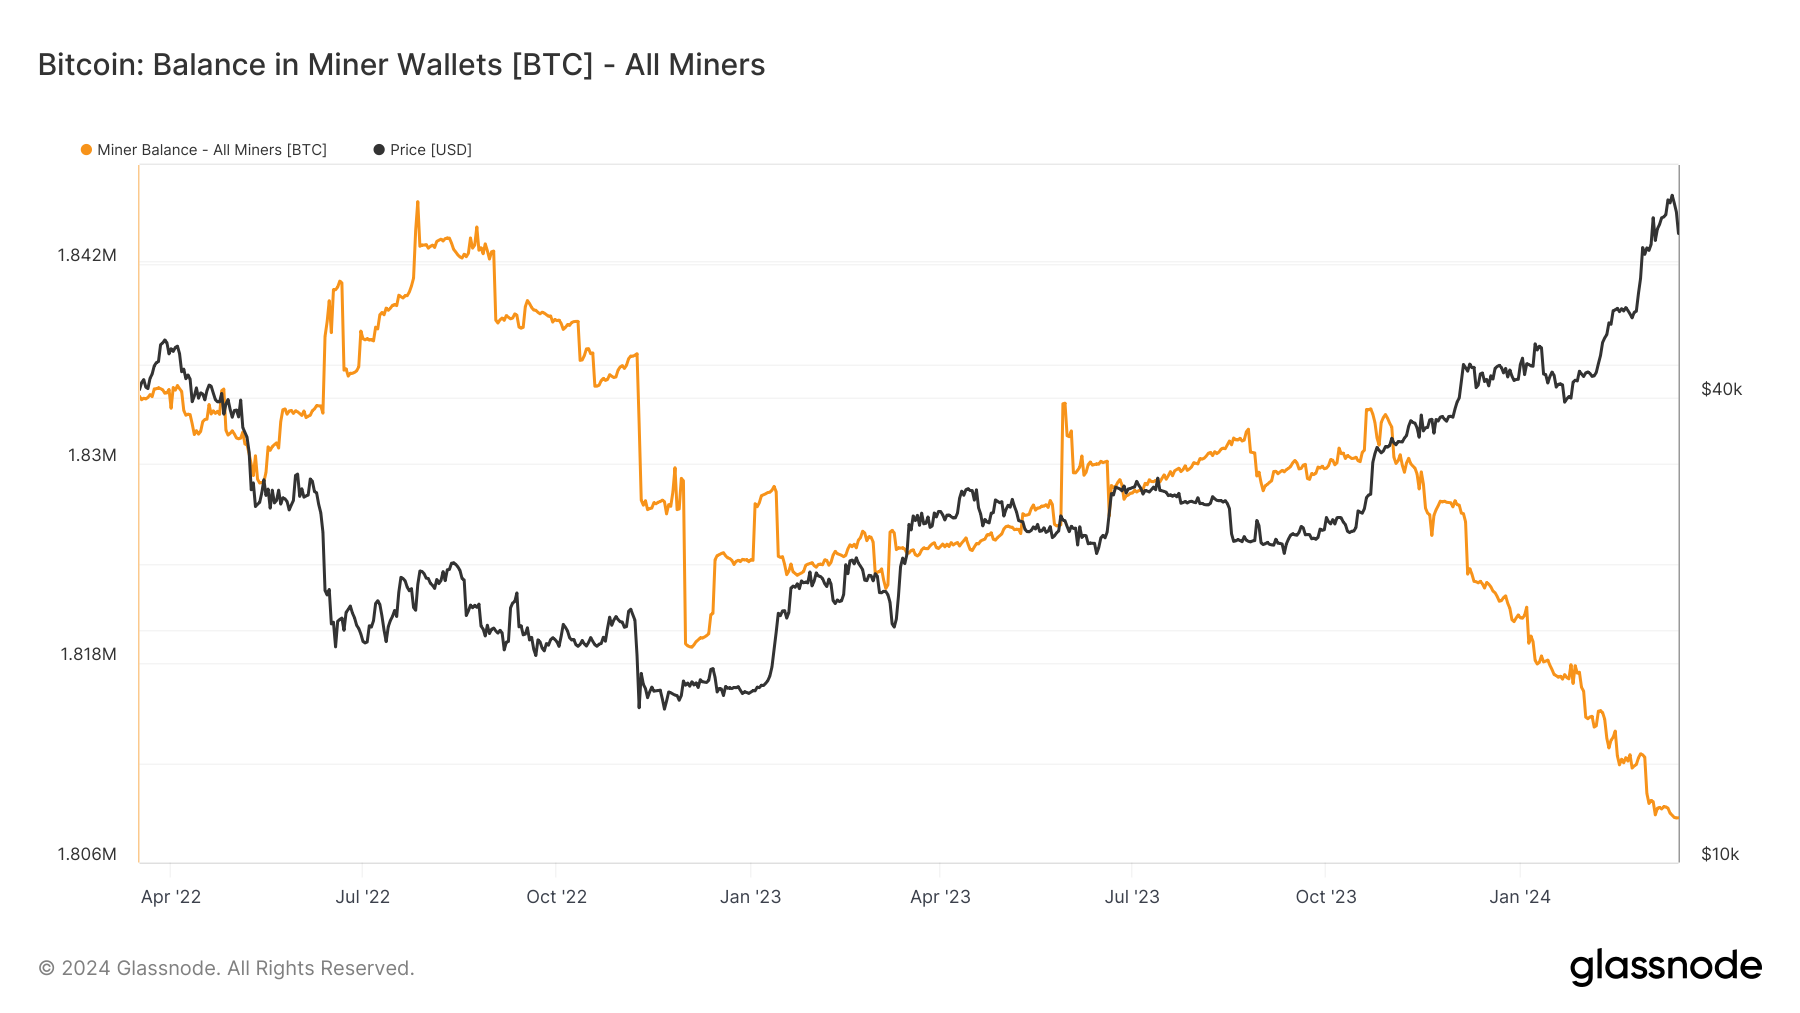
Yet, far from a sell-off move, this minor distribution activity appears to be opportunistic, with true long-term holders remaining astutely in accumulation – revealing that much of recent sell-pressure has come from Bitcoin Miners (as depicted by the declining Balance in Miner Wallets).
The stark distribution by 1-2 year holders (miners) versus continued accumulation into strength by seasoned 3+ year holders suggests that veterans (pre-2021 bull run) in the space remain bullish even at current price levels.
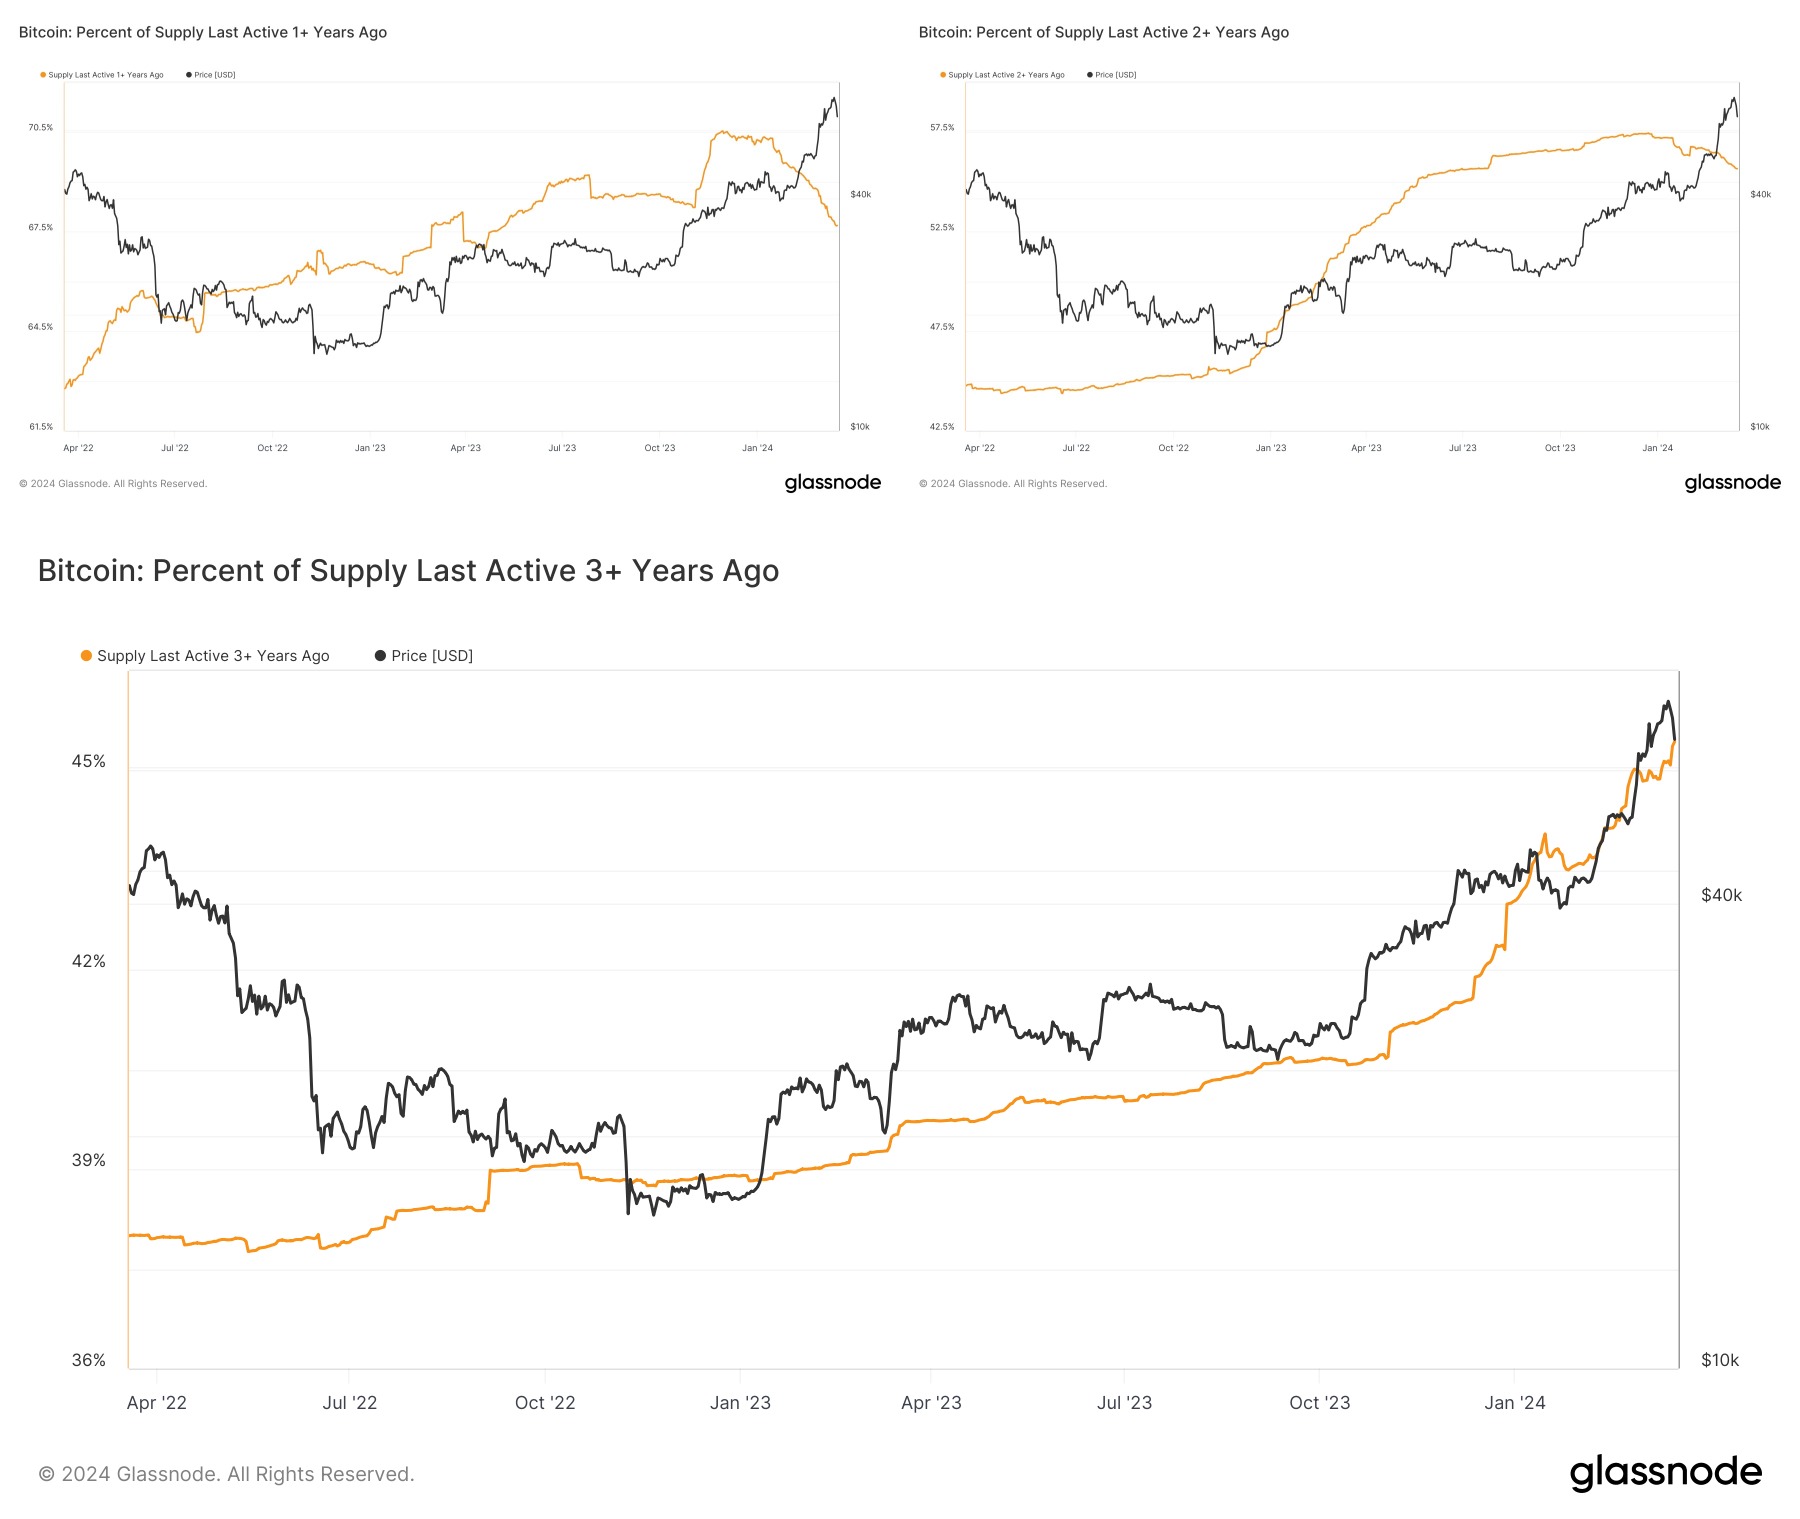
(% of Supply Last Active 1Y, 2Y 3Y+)
Furthermore, Bitcoin’s continued accumulation and price accrual, despite initial distributions by mid-term holders, spotlights the significance of Spot Bitcoin ETFs as a new fundamental force fuelling Bitcoin.
Indeed, the number of wallet addresses with more than 100 BTC ($6.85m USD) has skyrocketed since the SEC’s ETF approval, rising +1.4% over the past month – hinting at larger financial entities as the driver of market appetite.
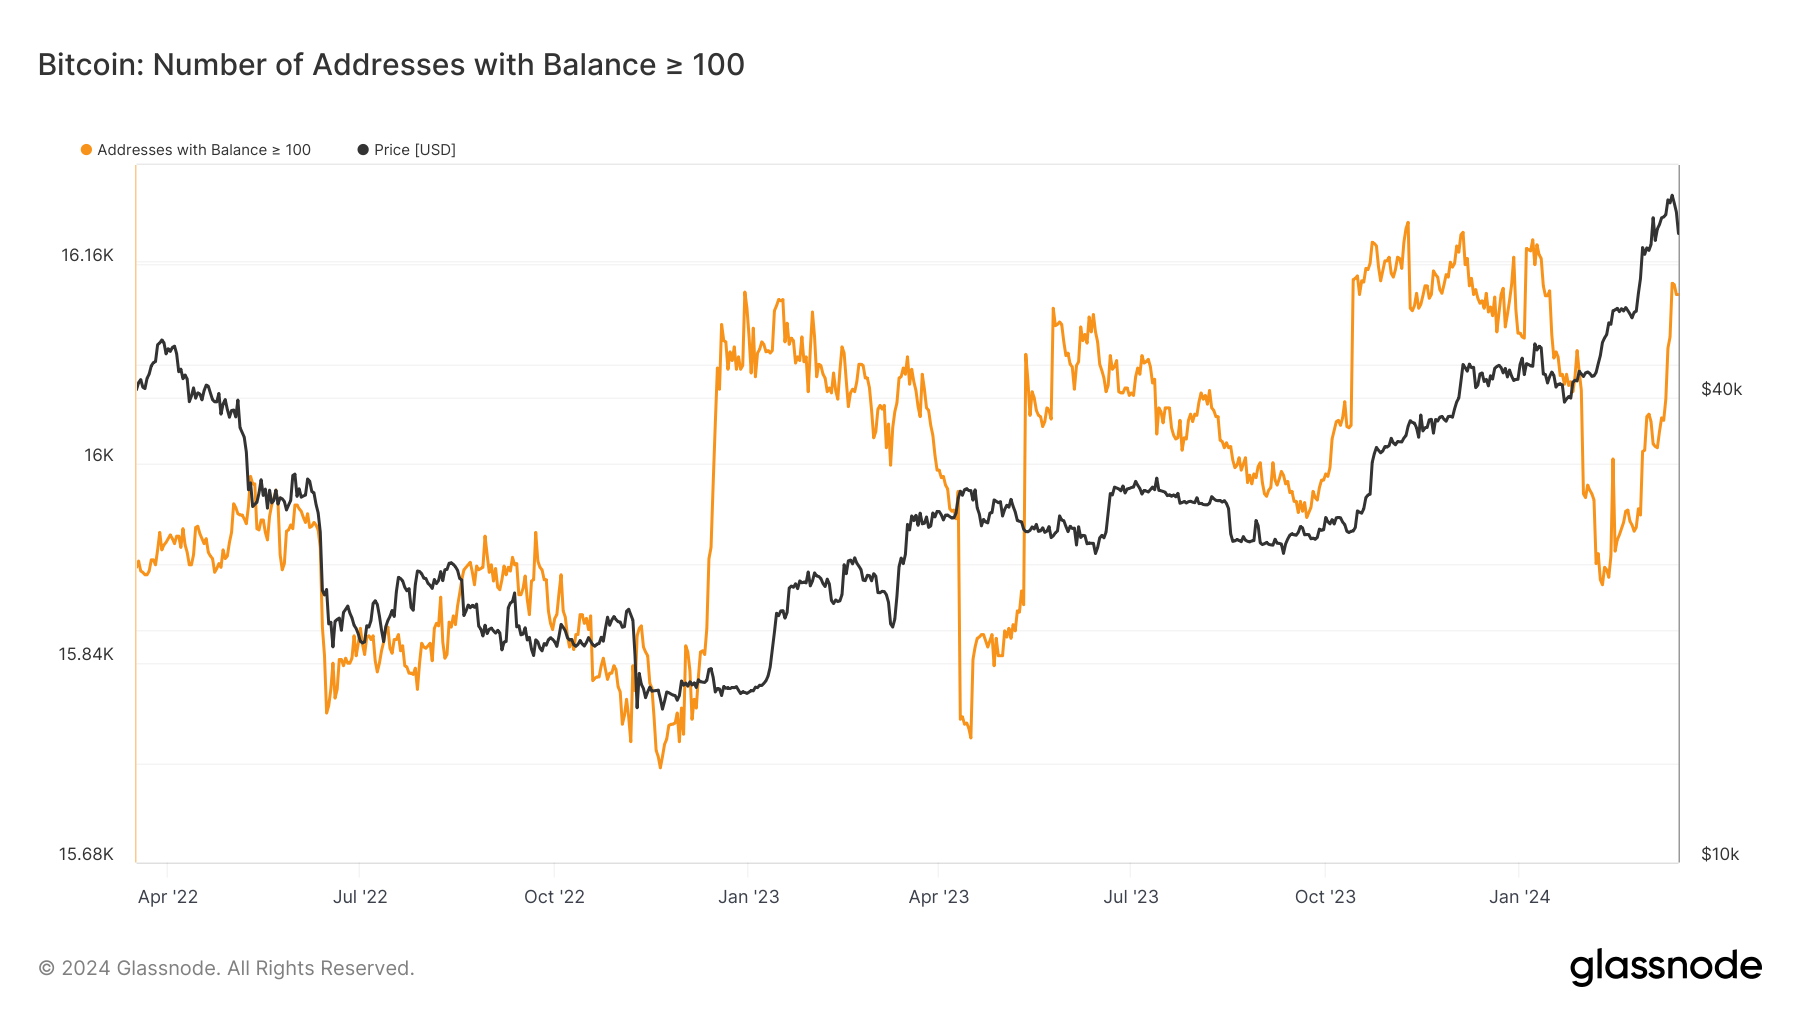
(Number of Addresses with Balance >100)
By comparison, the number of so-called ‘Wholecoiner’ addresses has declined by -1.1% in the same period.
The Key Question: Is The Bitcoin Cycle Top Here Yet? Or, Will Nvidia GTC 2024 Flip BTC Parabolic?
Monday marks just 31 days remaining until the much anticipated 4th Bitcoin Halving event, which will see miners’ block rewards reduced from 6.25 BTC to 3.125 BTC.
Yet, with Bitcoin mounting its first-ever pre-Halving all-time high, some fears remain in the market that the 2024 bull cycle could be front-run. But is this true?
A glance at the Stablecoin Supply Ratio Oscillator (SSRO – an on-chain measure of whether markets are sat in stablecoins or Bitcoin) reveals a small decline down to 1.92 in reflection of the minor distribution by miners.
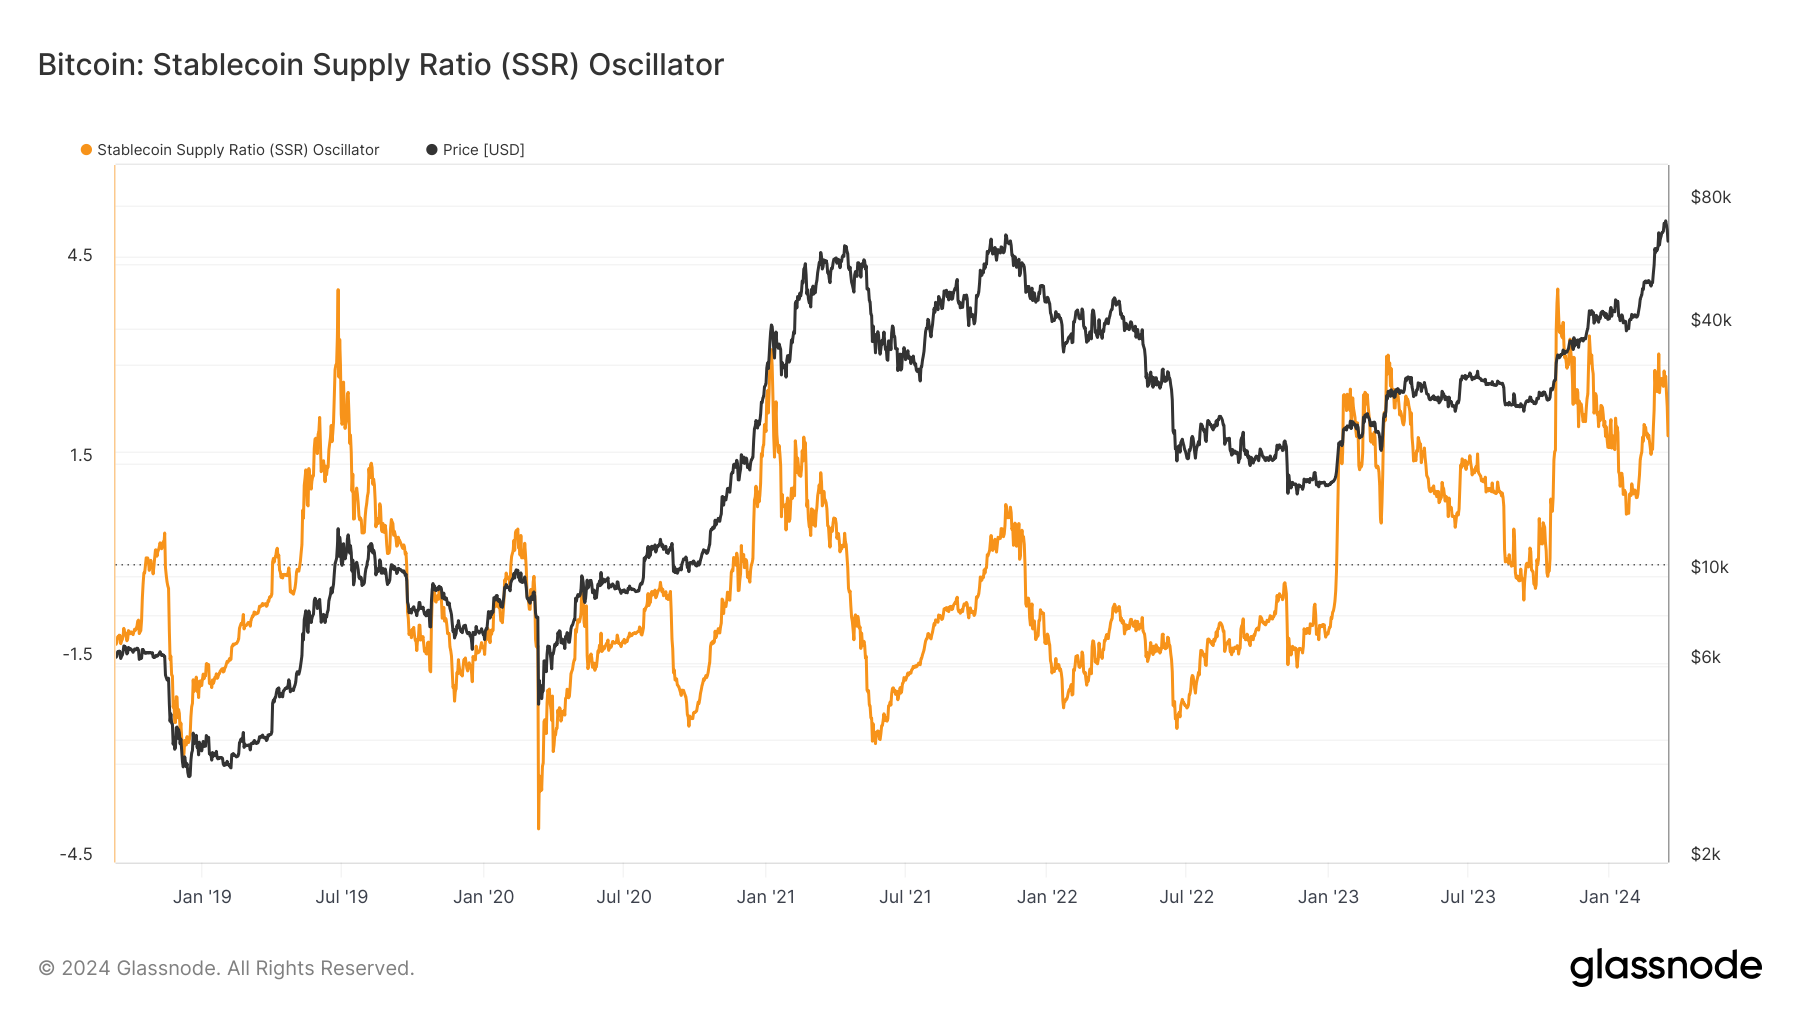
(Stablecoin Supply Ratio Oscillator)
However, the market remains heavily allocated into Bitcoin, with current levels comparable to January 2021 – suggesting that BTC price could be on the precipice of a major upside move in coming months.
Yet, it’s noteworthy that SSRO has hit these hits much earlier in the cycle than ever before, with the market sitting heavily in Bitcoin – at comparable levels to today – throughout 2023 despite crypto winter price levels.
This suggests that value accrual has come from fresh fiat capital, not significant inflows from stablecoin capital – another hint at the invisible hand of Spot Bitcoin ETFs in the market.
Yet, with prices hitting all-time highs, could this be the top?
NUPL conceptualizes the current profit sat on the table – a calculation of the difference between market cap and realized market cap.
Currently, Bitcoin’s NUPL stands at 0.59 as bulls sit in belief and bears sit in denial.
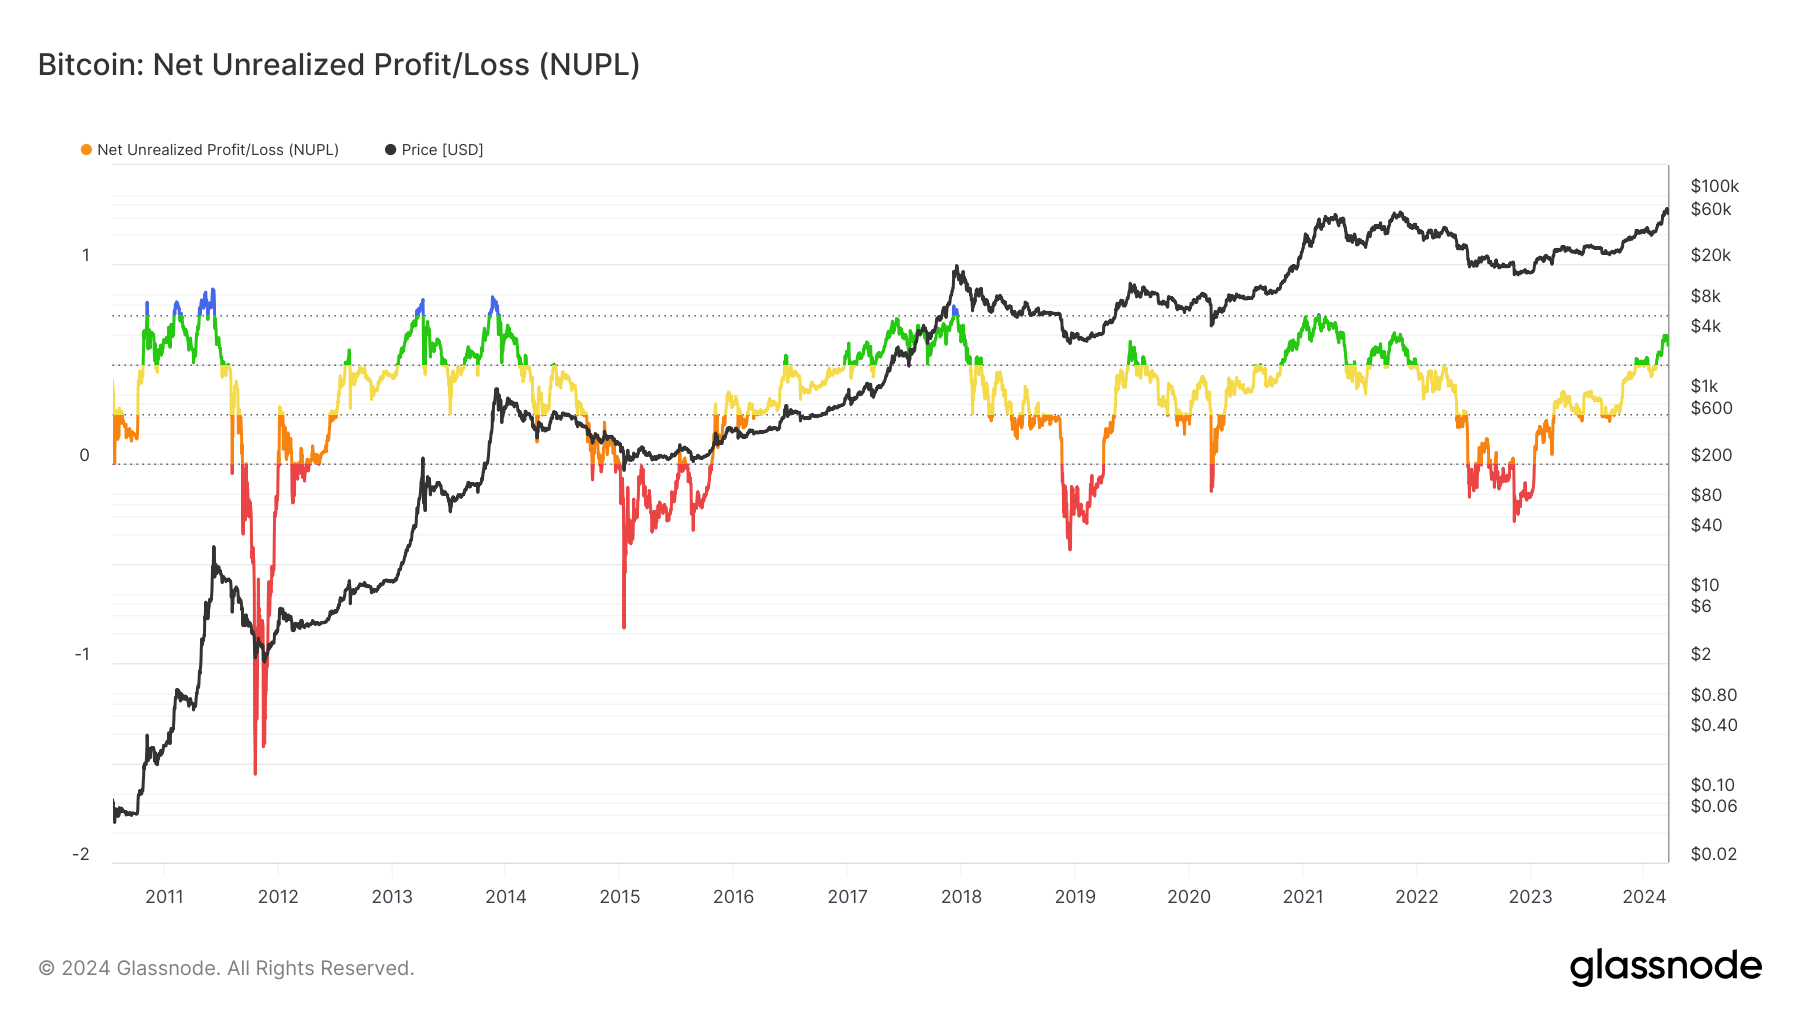
(Net Unrealized Profit / Loss)
This level (above 0.5) has signaled the onset of a bull market every halving cycle since 2011.
Going over historical NUPL data, the emergence of strong divergence above 0.5 foreshadows major price accrual 100% of the time, and these value accrual periods last for an average of 13.75 months – suggesting that the unfolding 2024 bull run could last until Spring 2025.
With the NUPL forecasting months of upside on the horizon, market confidence is high, and this is reflected in the reserve risk chart (a measure of confidence in the underlying risk/reward structure of BTC price action – the lower the reserve risk, the more attractive the risk/reward ratio).
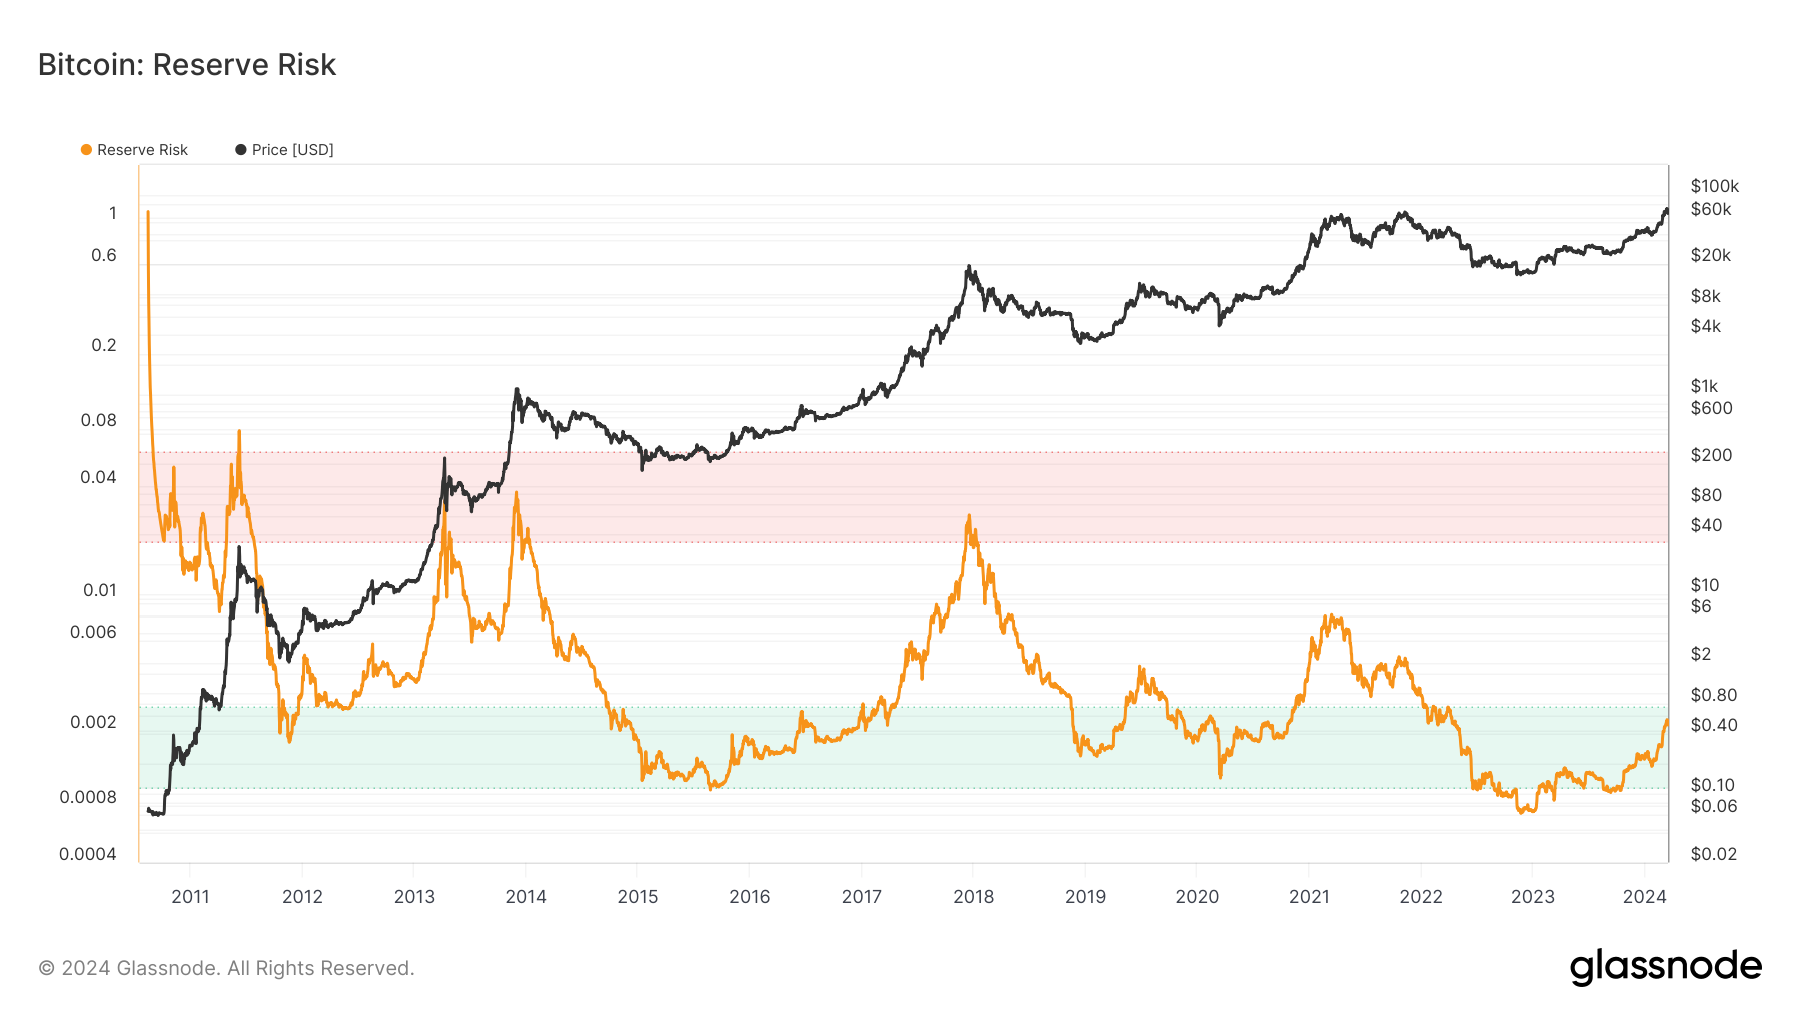
In perhaps the most bullish chart of all, despite Bitcoin hammering the top of its range over the past two weeks, Reserve Risk remains exceptionally low at 0.00216082.
This suggests that even at these levels, market confidence in the potential reward proposition of $70k Bitcoin is extremely high – signaling that the bull run is only just beginning – with levels currently comparable to the extreme lows of Winter 2016 or Winter 2011.
Bitcoin On-chain – The Bottom Line: Nvidia GTC 2024 Could Trigger Parabolic 2024 Bitcoin Bull Cycle
Overall, Bitcoin markets are poised with excitement heading into this week, with a well-defended consolidation in the charts over the weekend setting the stage for major gains amid the hysteria surrounding Nvidia GTC 2024.
If the Federal Reserve falls in line with expectations of no change in US interest rates, it seems likely that strong risk-on sentiment will continue to sustain strong inflows of institutional capital into spot Bitcoin ETFs.
Derivatives markets are stacked up high as bullish traders anticipate decisive movements, and this is backed by continued accumulation and exchange outflows to ETFs and long-term holders.
#BTC Bull Market Progress:
▓▓▓░░░░░░░ 33.9%$BTC #Crypto #Bitcoin pic.twitter.com/iiOKMQunVs
— Rekt Capital (@rektcapital) March 13, 2024
Meanwhile, on-chain, the bulk of the market remains heavily allocated into Bitcoin, as key on-chain metrics signal the start of a year-long bull market environment, backed by considerable confidence in Bitcoin’s current risk: reward proposition.
So, just 32 days until the Bitcoin halving event, market conditions are looking extremely bright, watch out for key announcements from the Federal Reserve on Wednesday, alongside announcements from Nvidia GTC 2024 throughout the week – happy trading!
EXPLORE: When Bitcoin Plunged To $68,400, BlackRock Bought Over $570 Million Of BTC
Disclaimer: Crypto is a high-risk asset class. This article is provided for informational purposes and does not constitute investment advice. You could lose all of your capital.
Why you can trust 99Bitcoins
Established in 2013, 99Bitcoin’s team members have been crypto experts since Bitcoin’s Early days.
Weekly Research
100k+Monthly readers
Expert contributors
2000+Crypto Projects Reviewed