This is 99Bitcoins’ weekly Bitcoin price analysis.
3/8/2015 – What to expect?
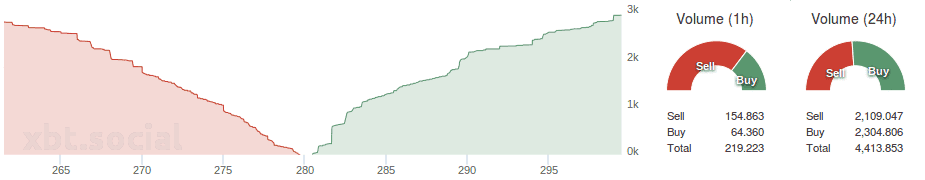
It was a bullish end of the week forBitcoin (somewhat expected), but the price managed to hold up. It was trading at $281.26. The buzz around the market was clear as the question came up whether the price drop was over or not. The price dropped from $298 to $276, which suggested an instant price plunge. As the MACD (3.9254) continued to slide from the Signal Line (6.2531), the Histogram fell further into the negative side (-2.3278). The Momentum indicator stood at -7.7500. The MFI was sitting at 59.7792 and the RSI held an unbiased value of 51.1520.

4/8/2015 – Up again
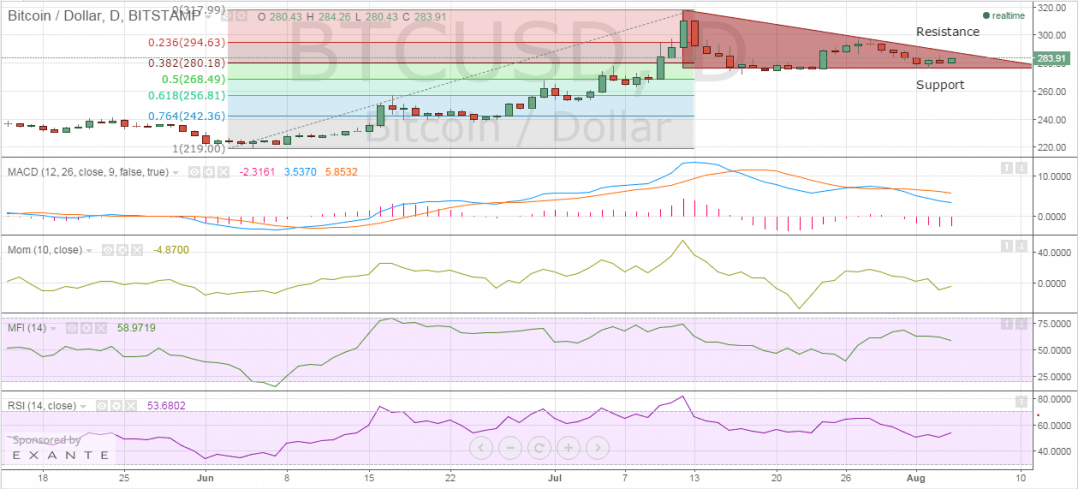
The support level held the market price as it was trading at $283.91, a 0.94 percent gain from the previous day. Buyers made some moves as the price jumped from $276. The chart suggested that Bitcoin might travel to a low-risk area. The MACD was the lowest since last month, at 3.5370. The Signal Line had a value of 5.8532, which kept the Histogram in the red with a value of -2.3161. The Momentum indicator gained a bit, but was still in negative territory (-4.8700). The MFI value weakened a bit and stood at 58.9719. The RSI was showing signs of price consolidation before any big movement.
5/8/2015 – Time to follow the analysis
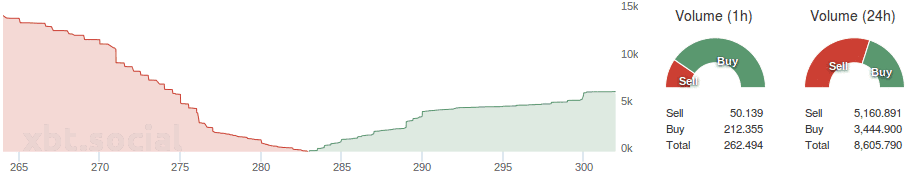
Bitcoin continued its mini rally as it gained 0.60 percent and was trading around $285.63; a $1.72 increase when compared to the previous day. The traders finally got the low risk opportunity they were hoping for, even though the market didn’t seem to give any clear indications.
The MACD value of 3.4487 was still below the Signal Line value of 5.4192. The Histogram had a value of -1.9705. The Momentum indicator faltered again dropping to -7.5600 from previous -4.8700. The MFI increased to 65.5654 and The RSI held steady at 55.2138.

6/8/2015 – Possibility of drop
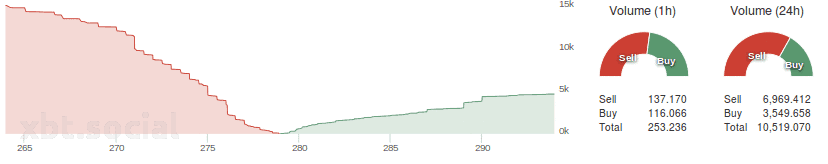
The market price didn’t hold up as it dropped by nearly two percent during the day. Bitcoin was trading at $281.01. The resistance level and the support level were heading closer suggesting a price breakout in the near future. The MACD (2.6263), the Signal Line (4.8240) and the Histogram (-2.1977) showed downward movement, supporting the crisis of the Bitcoin market. The Momentum indicator dropped even more and had a value of -13.2800. The MFI showed some strength with a value of 59.4824. The RSI continued to hold a neutral position at 50.5122.

7/8/2015 – Still dropping
All the technical analysis suggested the Bitcoin price was likely to drop and it did. It dropped around 1.41 percent and had a value of $277.10. The MACD was dropping even more with a value of 1.7040. The Signal Line also dropped to 4.1655 ensuring less differences and drop in the Histogram which had a value of -2.4614. The Momentum indicator also took a dip to -16.9100. The MFI value showed harsh decline, dropping to 49.1053 from 59.4824. The RSI value weakened a bit, as it dropped to 46.7666.

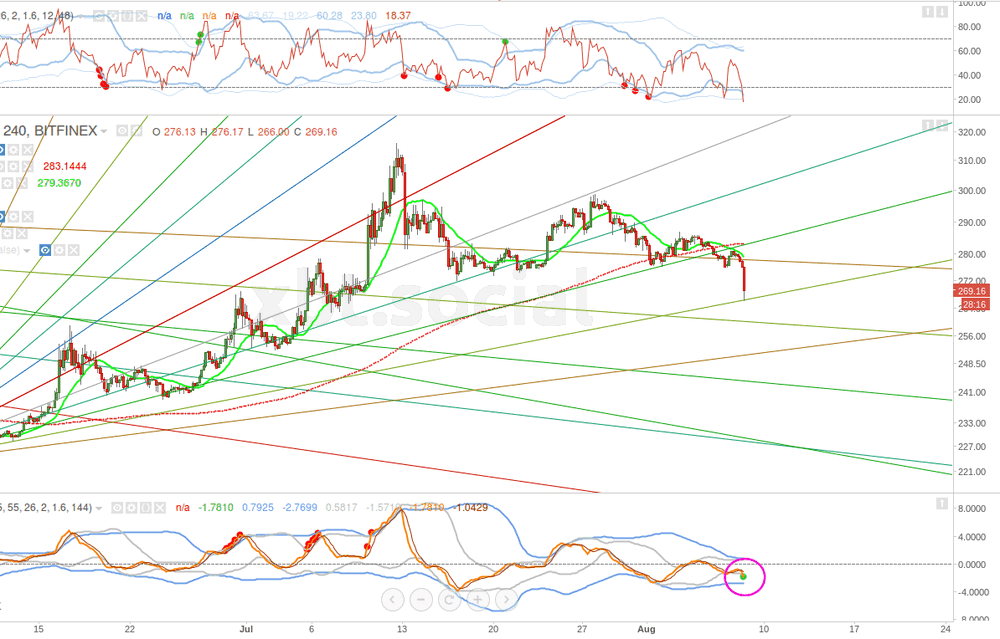
8/8/2015 – Dropping even more
The market is still showing declining signs as the price dropped to $269 mark. The price dropped by almost $10, a 2.77 percent fall when compared to Friday (7th). The MACD value was almost touching the zero mark and the Signal line kept the distance, keeping the Histogram value in the negative zone.
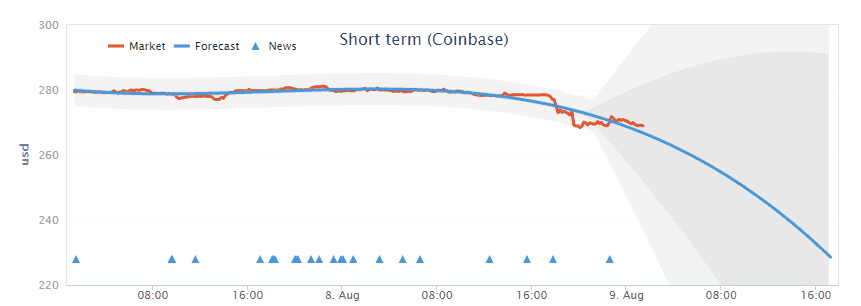
Weekly Bitcoin price prediction
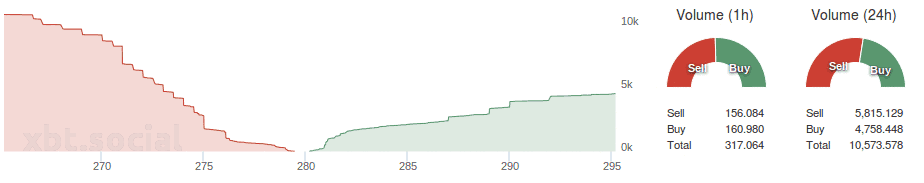
According to Coinbase, the Bitcoin price will keep dropping during the beginning of the next week and it may drop to the $240 mark.
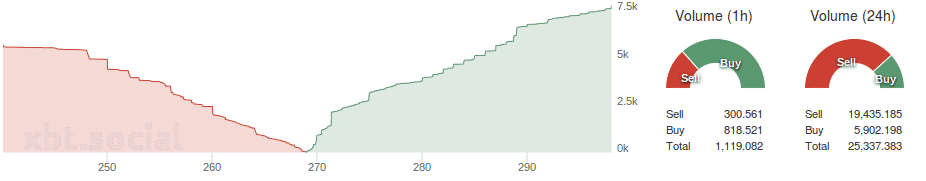
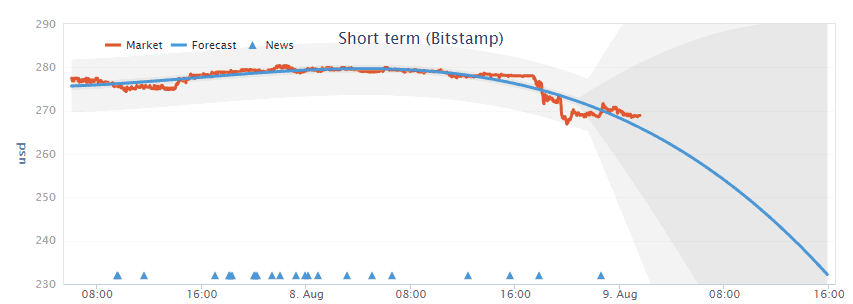
According to Bitstamp, the price is expected to drop and the market may touch as low as $235 at the beginning of the next week.
Summary
All the major analysis shows that the Bitcoin market price will continue to drop and touch the target level of either $250 or $230. The price may push up at some point soon to steady the ship, but till then the price will remain on the downside. The price should hover around the $250 mark.
Why you can trust 99Bitcoins
Established in 2013, 99Bitcoin’s team members have been crypto experts since Bitcoin’s Early days.
Weekly Research
100k+Monthly readers
Expert contributors
2000+Crypto Projects Reviewed