
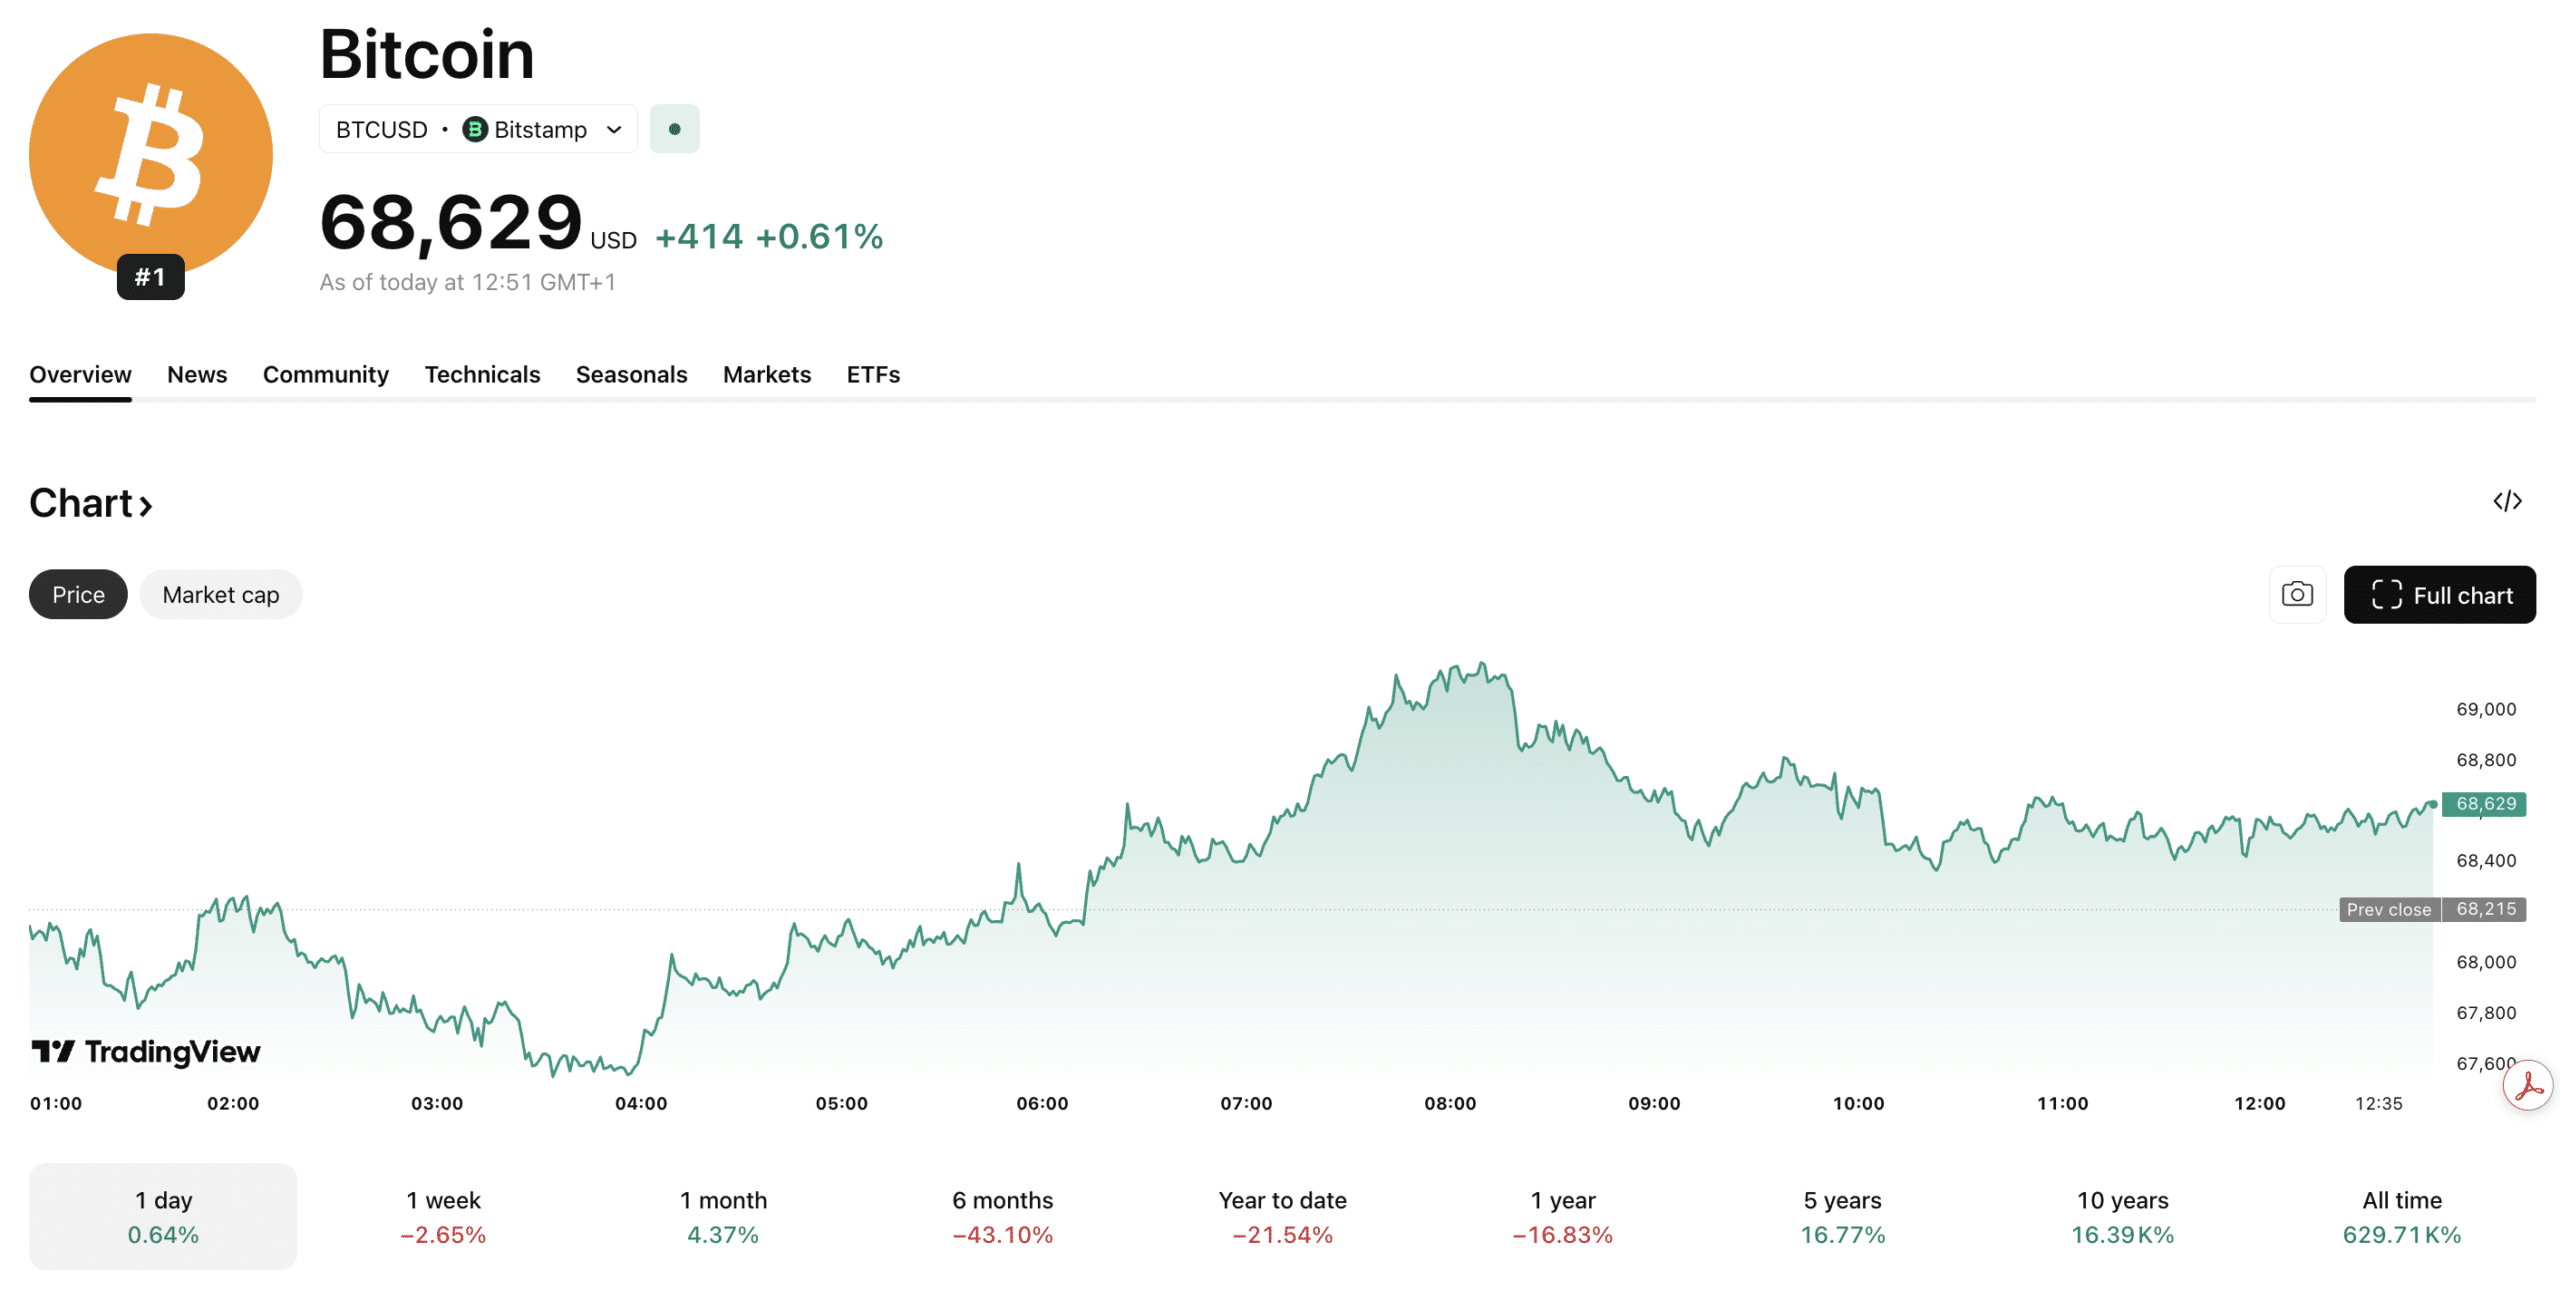
Bitcoin price is trading near $68,500, up 2.8% intraday, for a modest green candle that masks a more complicated picture beneath. The headline move looks encouraging for BTC USD price heading into April, although geopolitical stress is doing real damage to Bitcoin’s operational environment.
Continued closure of the Strait of Hormuz has driven energy costs high enough that mining operators began repurposing data centers, contributing to a -4% drop in Bitcoin network hashrate in Q1 2026.
Elevated oil prices are keeping central bank policy restrictive, which historically suppresses appetite for speculative assets. Withdrawal signals from US forces have offered brief relief, but unresolved sanctions and disputed maritime control keep the macro backdrop unstable.
Against that backdrop, Bitcoin’s technical picture in April 2026 deserves a closer read before making any moves. It comes as the broader crypto market has spiked +2.4% overnight, taking the combined market cap back over $2.4 trillion.
Can Bitcoin Price Break $70,000 This Week, or Is a Drop to $66,000 More Likely?
Price is sitting above the MA-50 ($68,697.88) but below both the MA-20 ($69,911.65) and the MA-200 ($90,603.40). That positioning, above short-term support, below medium-term resistance, signals mixed momentum rather than a clean trend. The Ichimoku Kijun at $70,000 marks the immediate ceiling. Getting through it matters enormously.
Daily momentum indicators are not cooperating. MACD is in sell phase. ADX shows weak trend strength. RSI and CCI both reflect mild selling pressure, while the Awesome Oscillator confirms seller momentum.
One bright spot: Bollinger Band Percent is in overbought territory, suggesting intraday buyers are still active near session highs. It’s a fragmented signal set, not the kind of clarity traders prefer before sizing up positions.
Three scenarios for the week ahead:
- Bull case: A clean break above $70,500 opens a path toward $72,000–$73,000. Binance’s April 2026 forecast targets an average of $102,956.72, suggesting longer-term optimism if macro conditions ease.
- Base case: BTC consolidates between $67,000 and $71,000, repeatedly testing resistance without a breakout. Analysts assign a probability of less than 20% to a sustained move higher in the near term.
- Bear case: A close below $67,000 triggers a retreat toward $66,000 or lower, with the Bitcoin Rainbow Chart’s “Fire Sale” band sitting near $56,182.96 as a deeper reference point.
DISCOVER: Next Crypto to Explode in 2026
Bitcoin Hyper Targets Early Mover Upside as Bitcoin Tests Key Resistance
With the Bitcoin price hovering below its MA-20 and fighting a restrictive macro environment, it creates a familiar dilemma for crypto allocators: hold and hope for a breakout, or rotate into earlier-stage plays where the upside math is structurally different. That calculus is driving attention toward Bitcoin Layer 2 infrastructure, specifically projects that expand what Bitcoin can actually do.
Bitcoin Hyper ($HYPER) is positioning itself as exactly that kind of infrastructure bet. It claims the title of the first-ever Bitcoin Layer 2 with Solana Virtual Machine (SVM) integration, meaning it aims to deliver smart contract speed and low-cost execution directly within Bitcoin’s security envelope (a combination that hasn’t existed before).
The presale has raised over $32M at a current price of $0.0136779, with staking already live for early participants. Features include a Decentralized Canonical Bridge for BTC transfers and extremely low-latency transaction processing, designed to address Bitcoin’s core limitations in speed, fees, and programmability.
Visit the Bitcoin Hyper Presale Website Here.
EXPLORE: Top Crypto Presales to Watch Now
Follow 99Bitcoins on X (Twitter) For the Latest Market Updates, and Subscribe on YouTube For Daily Expert Market Analysis.
Why you can trust 99Bitcoins
Established in 2013, 99Bitcoin’s team members have been crypto experts since Bitcoin’s Early days.
Weekly Research
100k+Monthly readers
Expert contributors
2000+Crypto Projects Reviewed