
Ethereum is the coin everyone is eyeing in expectations of a new ATH. People in the crypto world are impatient and can’t wait anymore for the long awaited alt season. When will it come? When ETH breaks towards new All-Time-high. Let’s take a look at the charts for this Ethereum Technical Analysis article.
JUST IN: $250,000,000 worth of Bitcoin & Ethereum shorts liquidated in the past 24 hours.
— Watcher.Guru (@WatcherGuru) September 29, 2025
Shorts are getting liquidated today and bulls are celebrating. That is surely a bullish sign and it sparks hopes of continuation of the uptrend. Will we see a new ATH for ETH in October?
DISCOVER: The 12+ Hottest Crypto Presales to Buy Right Now
| Coin Name | Ethereum (ETH) |
|---|---|
| Ethereum Price | $1,855.13 |
| Ethereum Price Change 24h | ▼ -2.08894% |
| Ethereum Price Change 7d | ▲ 0.78% |
| Ethereum Market Cap | $223,405,874,829 |
| Circulating Supply | 120,232,214 |
Ethereum Technical Analysis: End Of Month Charting
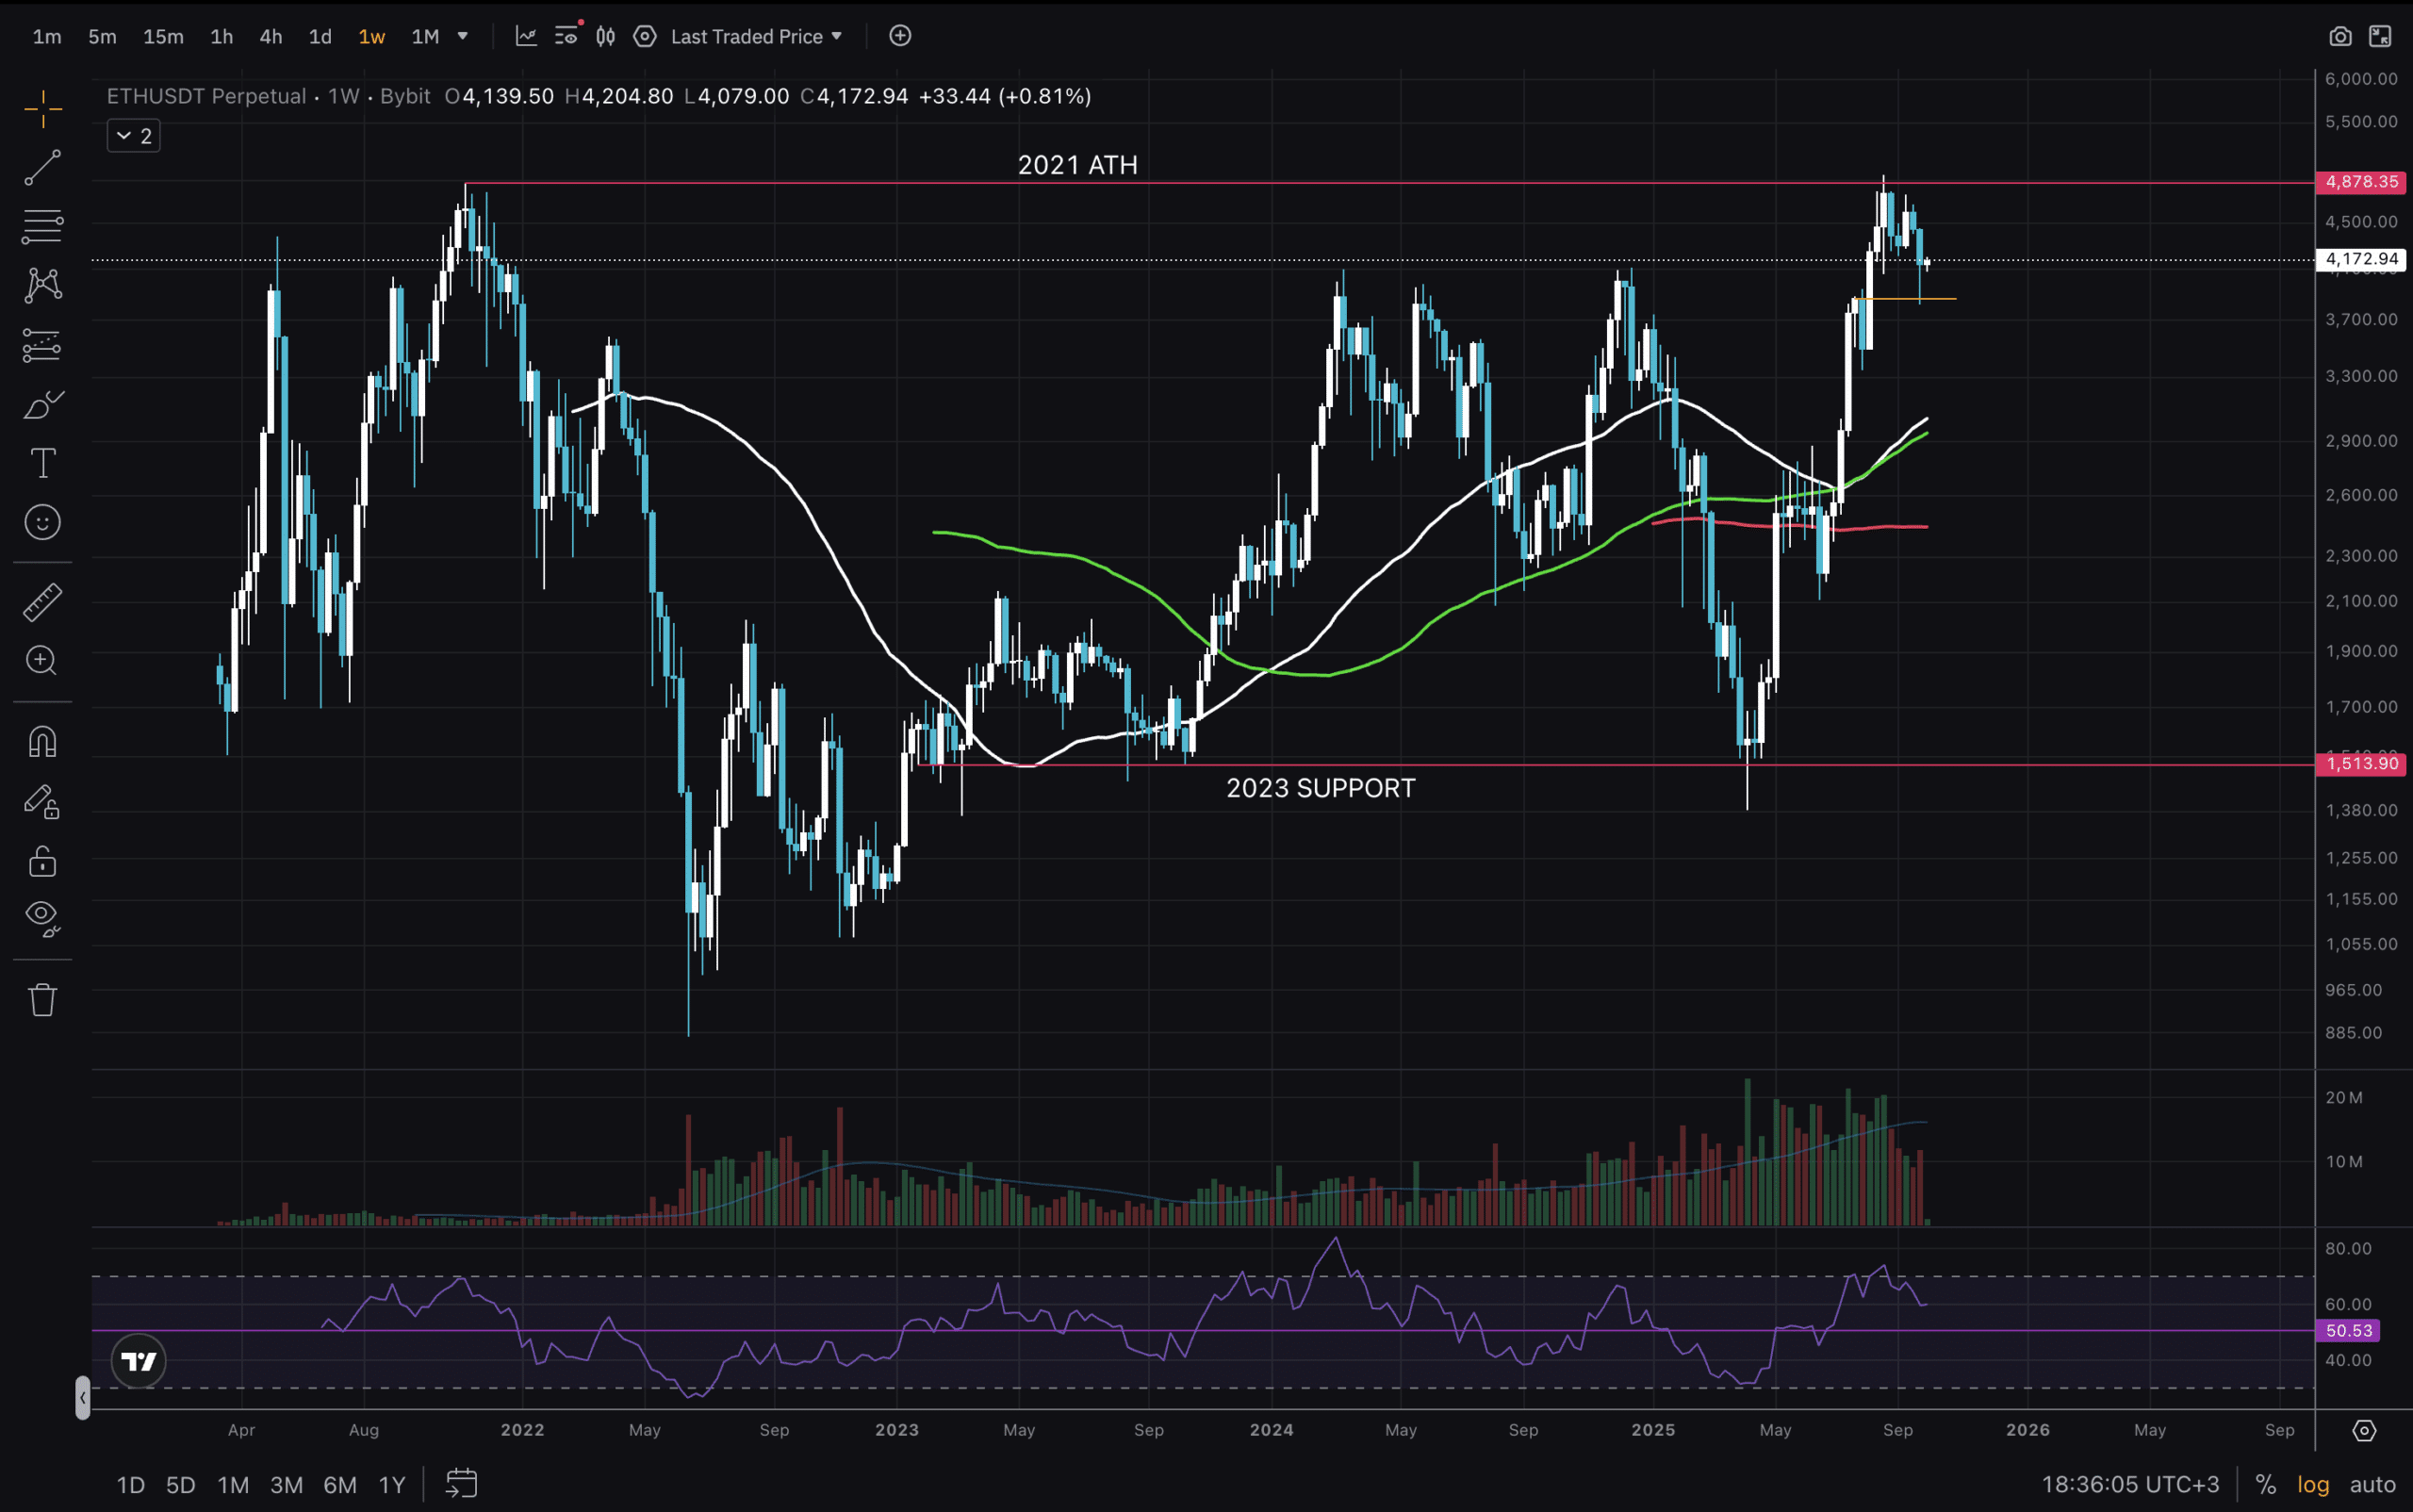
(Source – TradingView, ETHUSD)
The first graph we will analyse is on the Weekly timeframe. The end of 2024 and in early 2025 we saw some wild volatility. And then volume grew as price went up to brake the 2024 high, which is currently acting as support. We are still to break and close above the 2021 ATH, which for many will be the start of the long awaited Alt Season. Being above the Moving Averages indicates our uptrend.
DISCOVER: Best New Cryptocurrencies to Invest in 2025
 (Source – TradingView, ETHUSD)
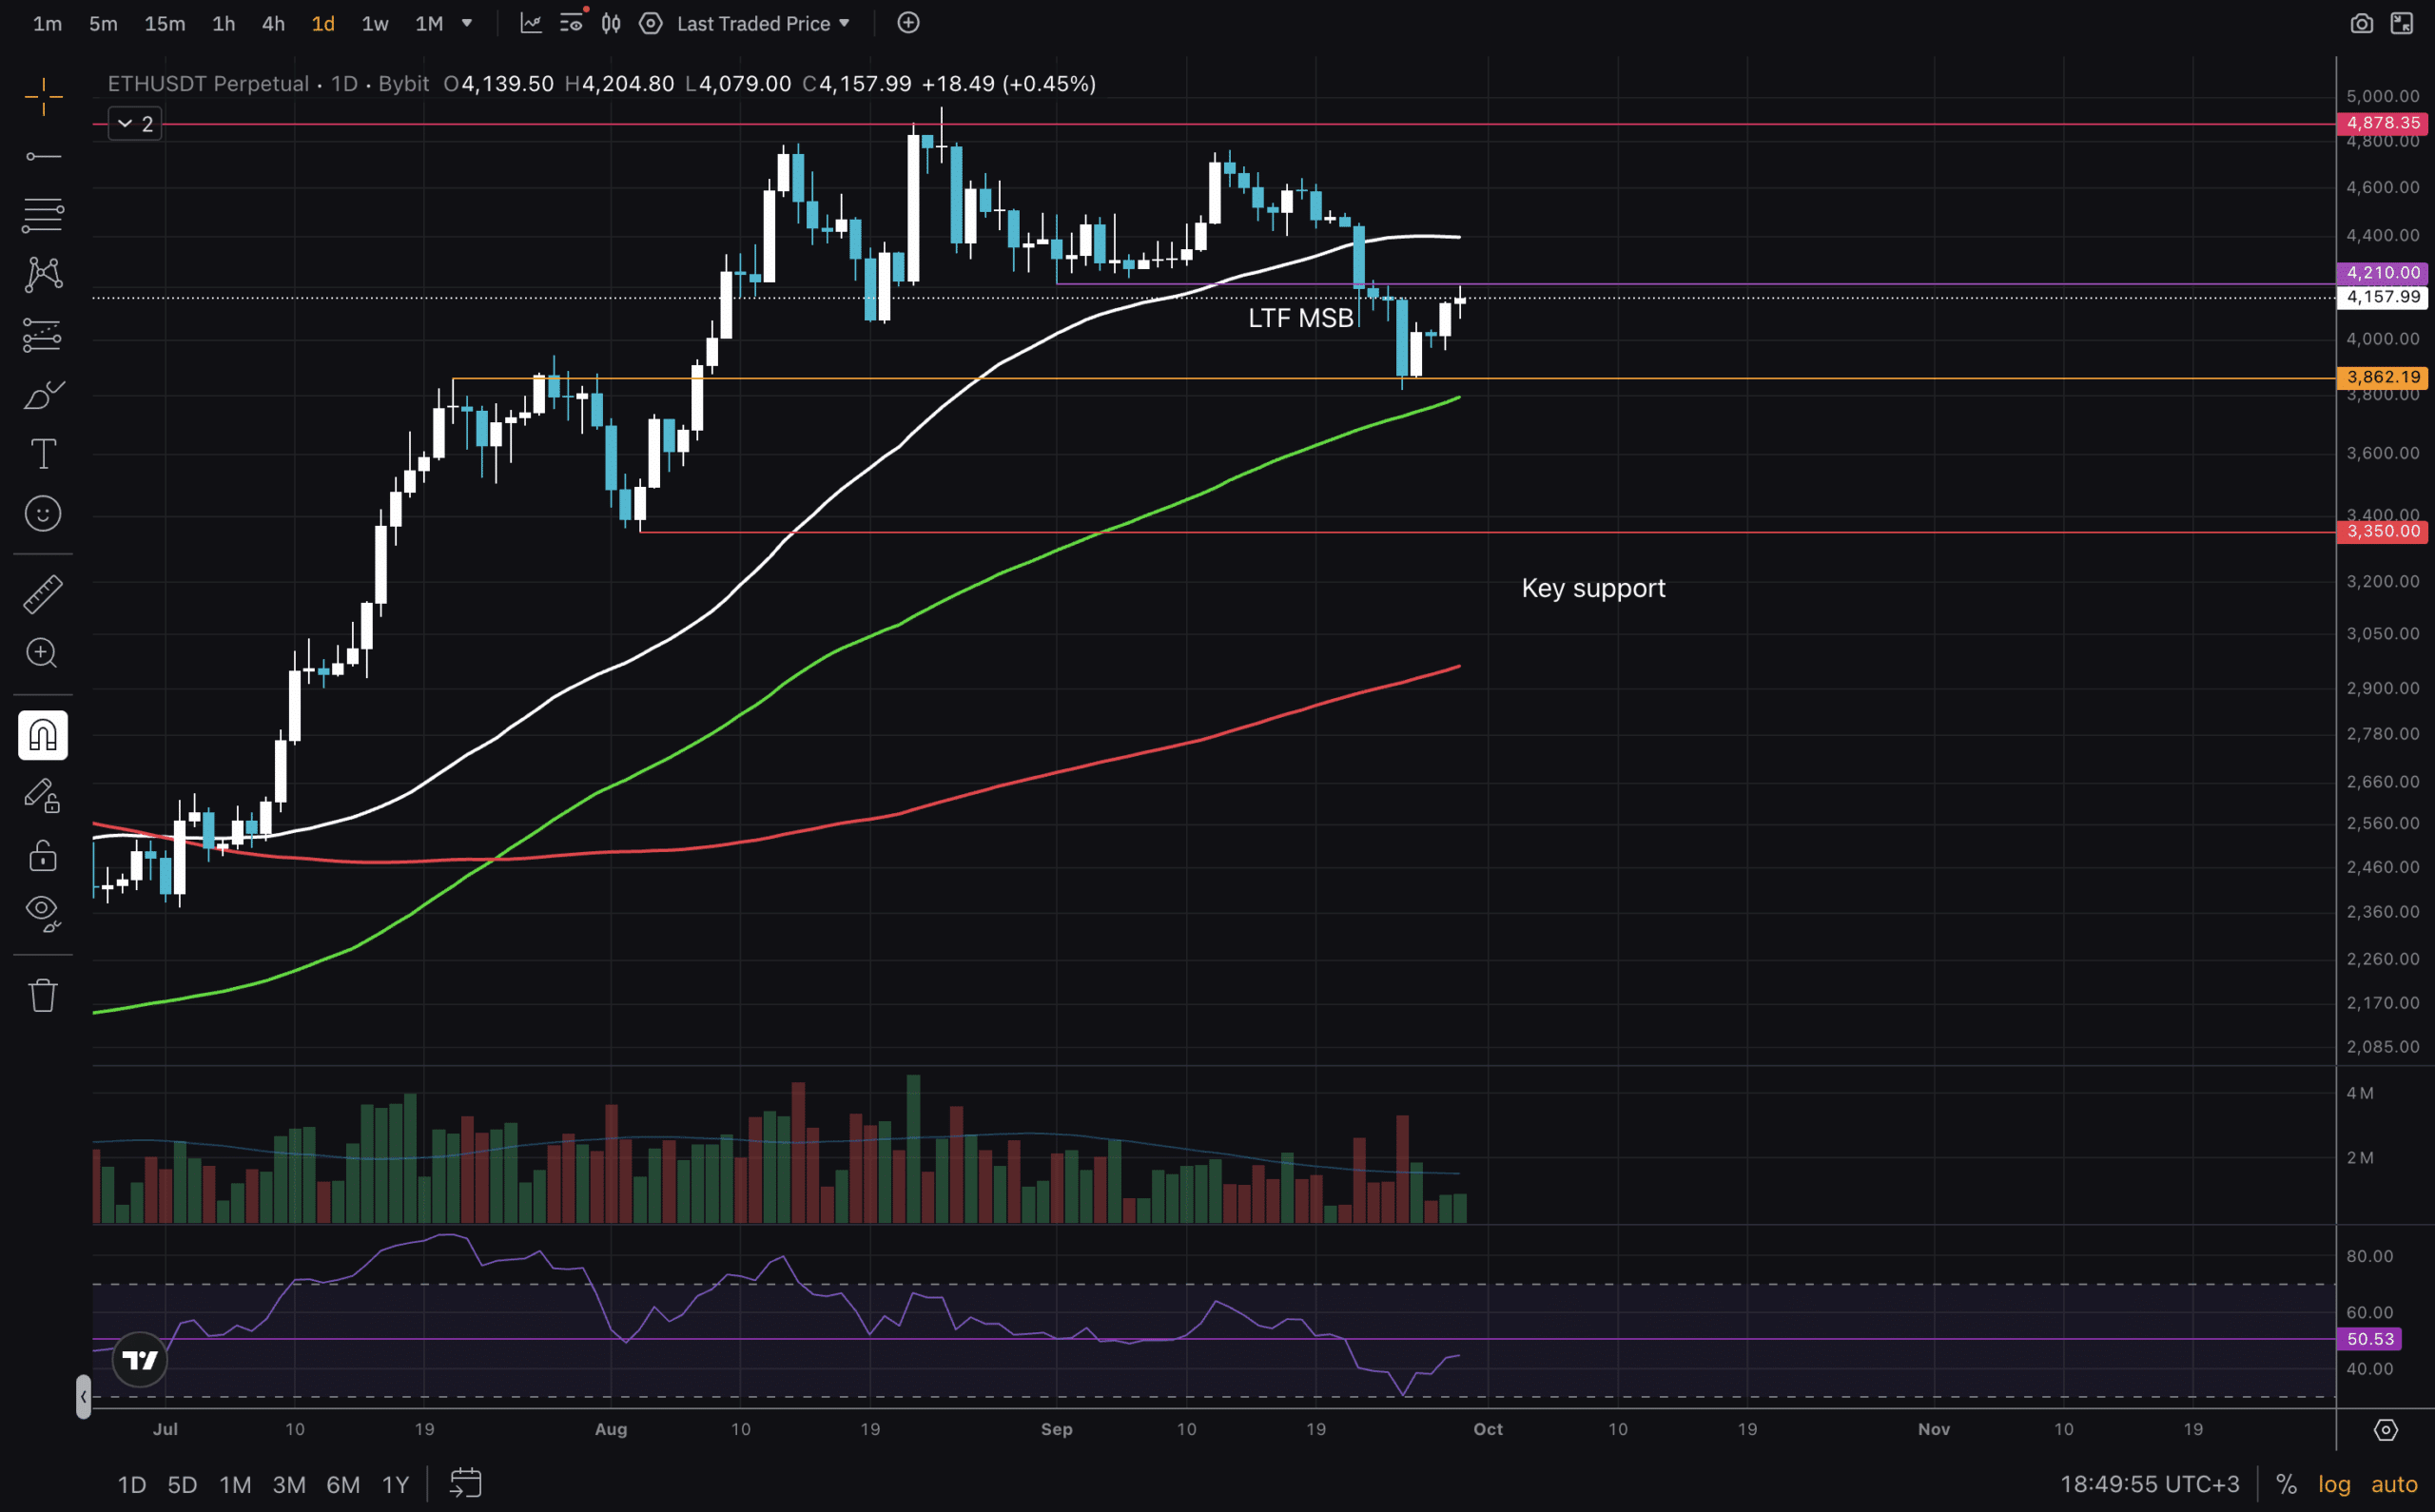
Zooming in on the 1D timeframe, we can see that in July the Moving Averages flipped into uptrend mode. Likeable! We have the July high acting as support just recently and the low from August 3rd as Key support level at $3350. RSI has come all the way to the bottom of its range, which means it has reset. Now there is enough air to fill to the upside in order to see price push and close into the $5000s.
DISCOVER: 20+ Next Crypto to Explode in 2025
Concluding Thoughts and Lower Timeframe View
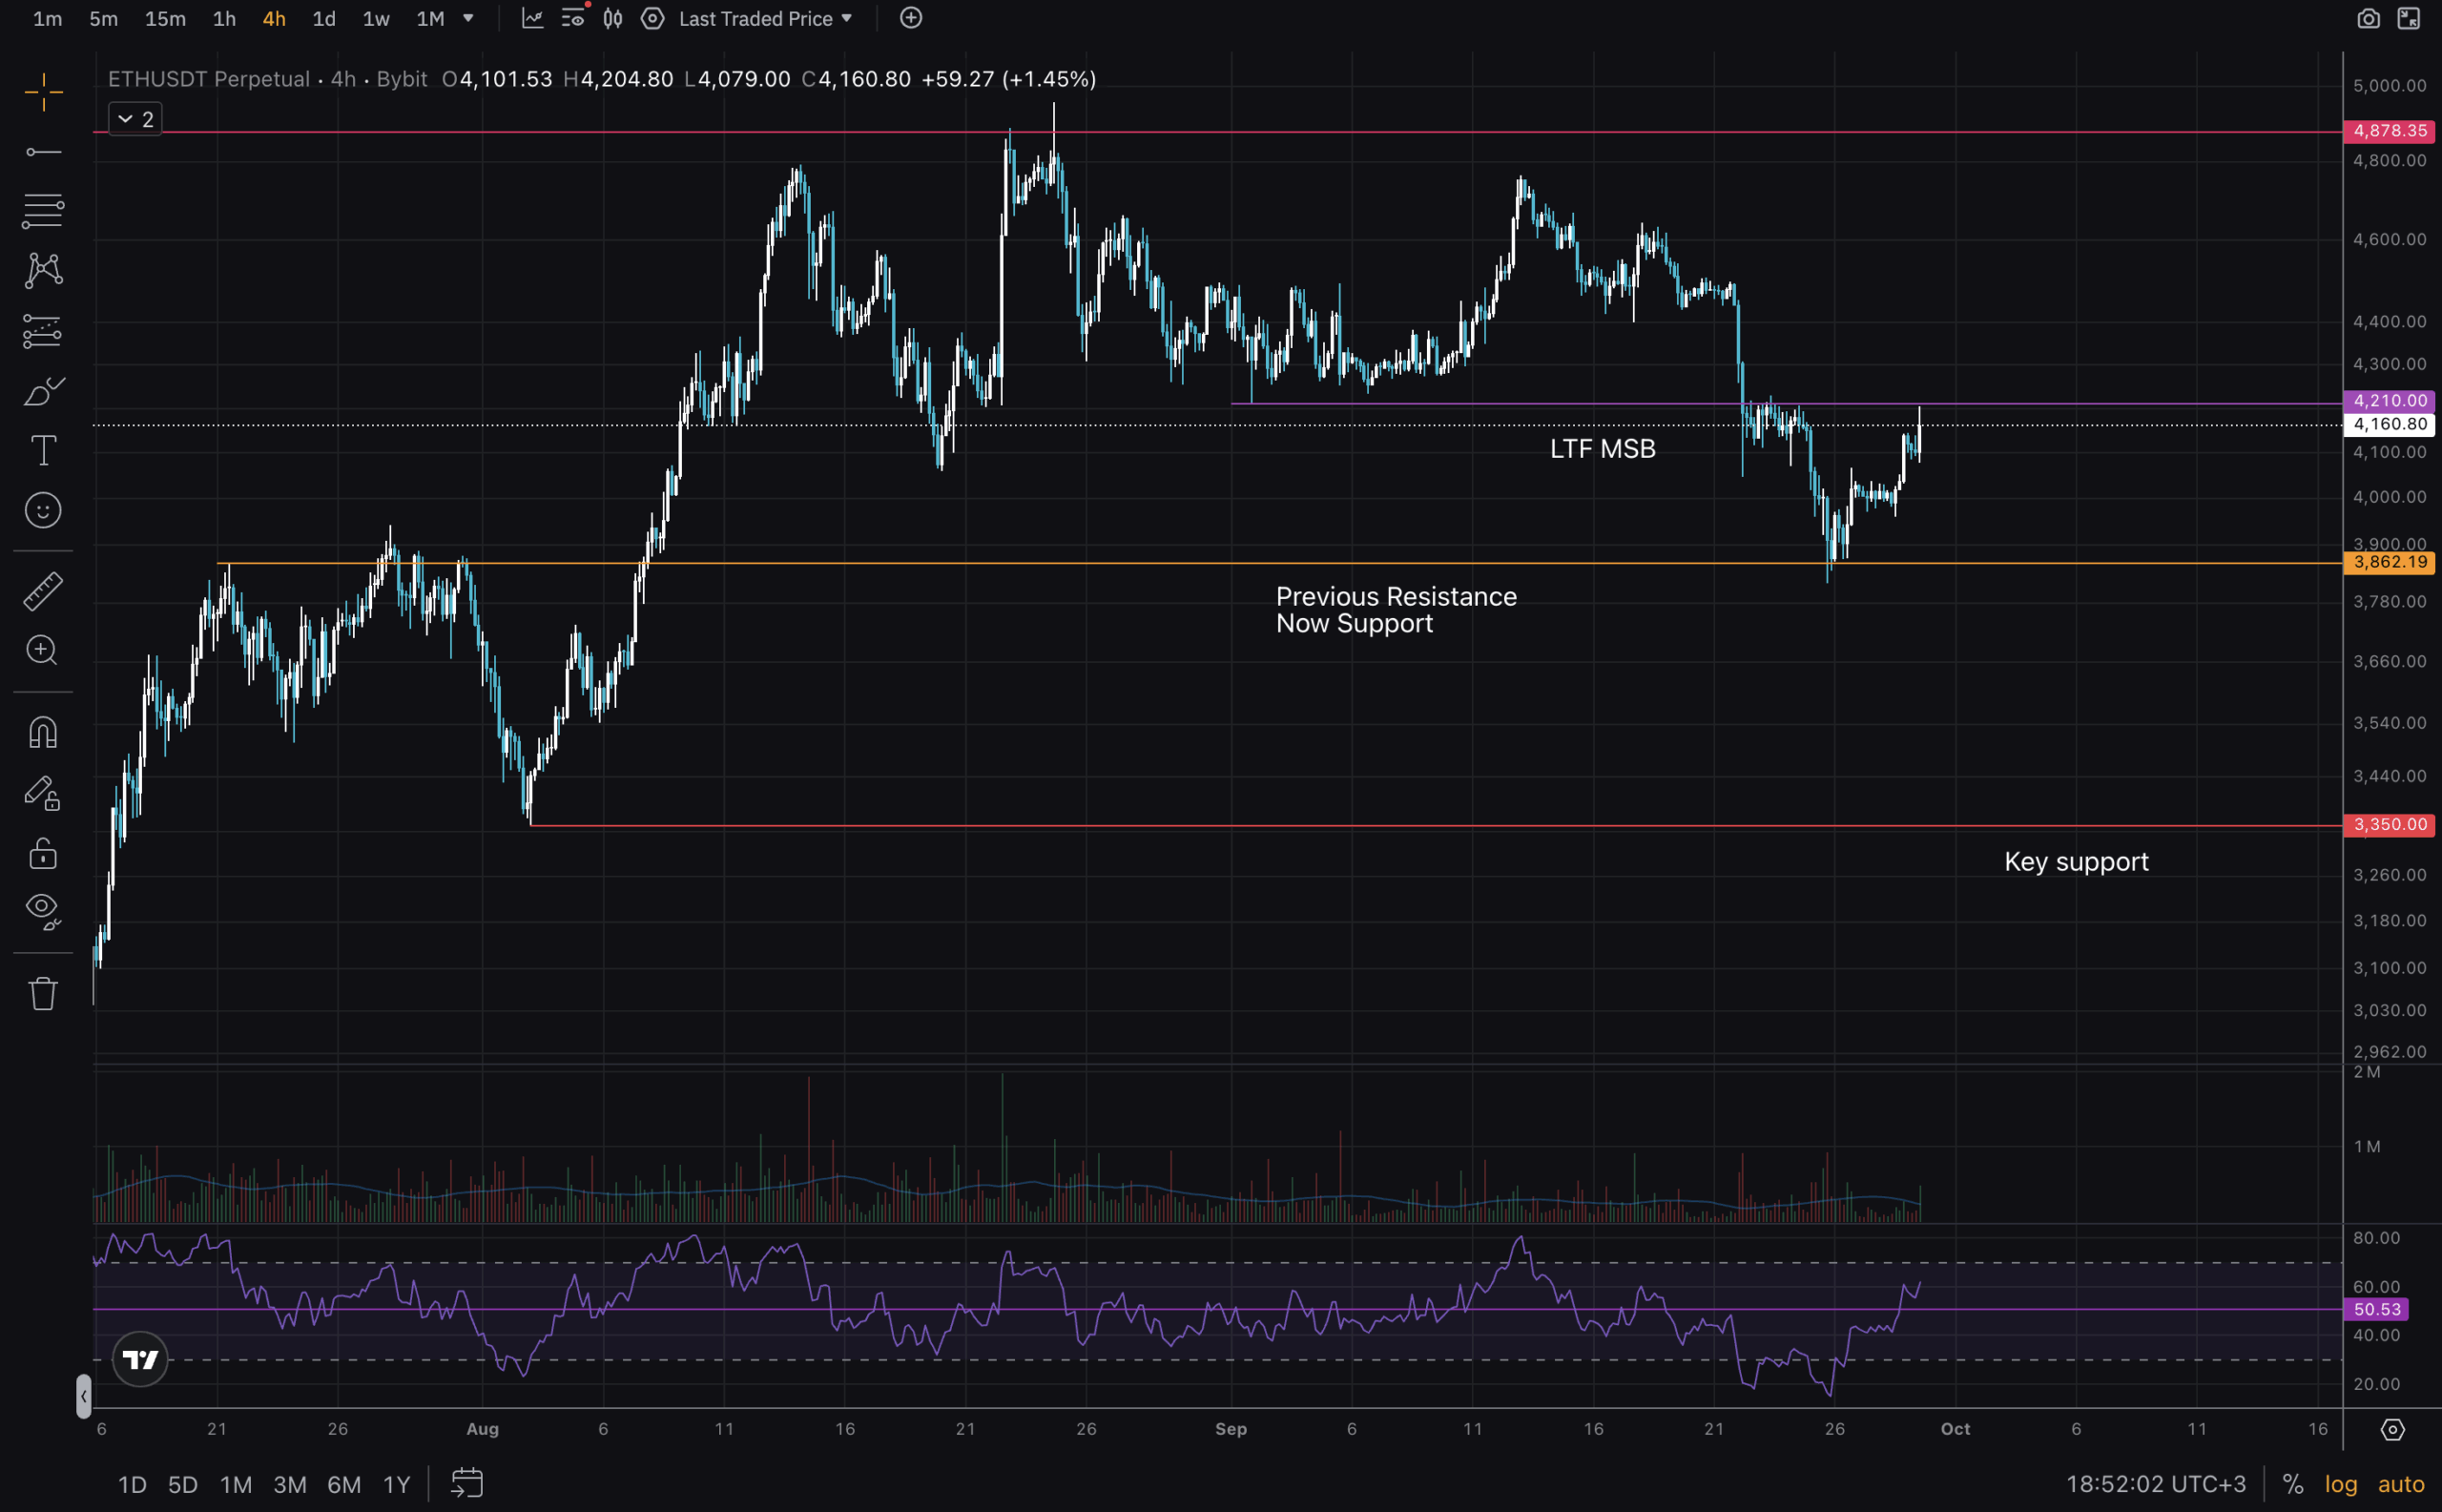
(Source – TradingView, ETHUSD)
Finishing up our Ethereum technical analysis on the 4H timeframe, we can clearly see the Low-Timeframe Market Structure Break (LTF MSB). $4210 is a level that needs to be reclaimed first, before moving higher. It is possible that the $3860 holds and we don’t see price go lower. But it is good to have ammunition of it does retrace further. RSI has been reset. Price here is below the 4H moving averages and it needs to reclaim $4400 to go back above.
Happy trading and stay safe!
DISCOVER: 9+ Best High-Risk, High-Reward Crypto to Buy in 2025
Join The 99Bitcoins News Discord Here For The Latest Market Update
Ethereum Technical Analysis: Insights For End of September 2025
- Beautiful 1W chart with break and retest of 2024 High
- RSI on 1D and 4H looks reset
- First support at $3,860, second support at $3350
- Has to regain $4400 before hopes for new ATH.
Why you can trust 99Bitcoins
Established in 2013, 99Bitcoin’s team members have been crypto experts since Bitcoin’s Early days.
Weekly Research
100k+Monthly readers
Expert contributors
2000+Crypto Projects Reviewed