So, you want to dance with the devil in a futures contract? Welcome to the deep end of crypto where Bitcoin futures aren’t just a financial instrument, but also a test of conviction. You’re no longer just buying Bitcoin. You’re time-traveling. You’re placing bets on where that beautiful, volatile beast will be tomorrow, next week, next quarter all without owning a single sat.
Forget HODLing. That’s for your cousin who still doesn’t get gas fees. This guide is for traders, speculators, risk-takers, and maybe some puzzled boomers with some extra time and a Coinbase account. Here’s your simple guide to trading Bitcoin futures, the best platforms to check out, the risks to know, and if you can survive your first liquidation cascade.
I’m talking to the anons chasing Bitcoin exposure with 100x leverage and the classy degens looking to scalp the CME CF Bitcoin Reference Rate like a polite sociopath, this is your new trading bible. Let’s rip.
Key Takeaways
- Bitcoin futures let you bet on the future price of BTC without actually owning the asset.
- You can trade BTC futures with leverage up to 100x on some platforms, just don’t blow up your account.
- Top platforms like PrimeXBT and MEXC offer intuitive interfaces for both degens and newbies.
- Unlike spot trading, futures contracts come with expiry dates, funding fees, and liquidation risk, manage your exposure.
- Futures trading gives you more capital efficiency and deeper access to BTC market volatility.
- You don’t need to own any Bitcoin to trade Bitcoin futures, just guts, a strategy, and collateral.
How to Trade Bitcoin Futures: Summary
Trading Bitcoin futures is like playing chess on a tilt-a-whirl. It’s fast. It’s strategic. And if you blink, you’re checkmated, wallet empty, pride in shambles. First, pick your battleground. MEXC if you want to jump straight into the action with minimal sign-up procedure, or PrimeXBT if you are looking for the biggest exchange with the most comprehensive features and options.
Choose your weapon: perpetuals if you want to ride the wave forever, quarterlies if you enjoy calendar stress. There are micro Bitcoin futures if your bankroll’s still recovering from the last bull trap. Dial in the leverage, 2x if you’re sane, 50x if you’re feeling lucky. Long if you believe in halving hopium. Short if you’re betting on macro doom. Place the trade, manage your Bitcoin exposure, and don’t forget: the market doesn’t care about your feelings. Only your margin.
Top Platforms to Trade Bitcoin (BTC) Futures
Not all Bitcoin futures trading platforms are created equal, some feel like Wall Street with extra latency, others are straight-up slot machines dressed in crypto UX. The trick isn’t just finding where to trade it’s knowing which one suits your level of brain damage and conviction.
You want leverage? Cool. But do you want a regulated exchange like CME Group, or are you vibing with a no-KYC mobile-first app that settles trades faster than you can say micro Bitcoin?


Below are the five platforms that actually matter in 2026. Let’s break them down.
PrimeXBT– Best Exchange to Trade Bitcoin Futures
PrimeXBT is our top pick for futures traders in 2026. It offers perpetual futures for more than 160 of the most popular tokens, from majors like BTC and ETH to DeFi tokens like ENA and NEAR to trader favorites like XRP and DOGE.
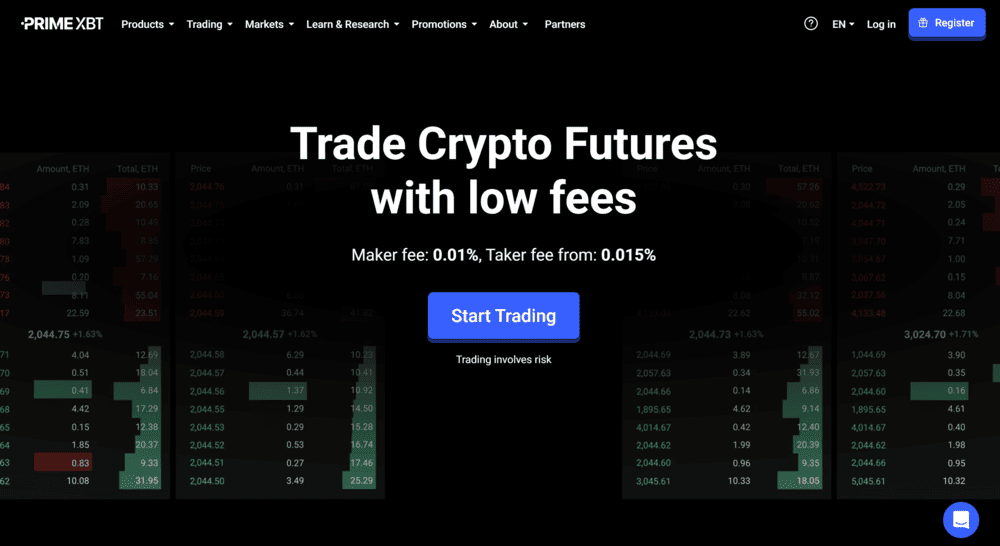
Even better, leverage for pairs like BTC and ETH maxes out at 400:1. Compare that to 100:1 at a lot of other crypto futures trading platforms, and it’s easy to see why PrimeXBT is so popular among seasoned traders.
PrimeXBT also has all the other key elements that make a futures trading platform great. You get access not only to PrimeXBT’s proprietary trading platform when you sign up, but also major broker-agnostic trading terminals like MetaTrader 5 and PXTrader 2.0. You also benefit from PrimeXBT’s unique “zero stop-out” feature, which gives your trades a second chance by allowing them to stay open through drawdowns until your margin reaches 0%.
PrimeXBT’s fees are competitive at 0.01% for makers and 0.045% for takers, with volume and VIP discounts available for high-frequency futures traders. Support is available 24/7 and all accounts include negative balance protection, so you’re always protected when stepping out into a massive futures trade.
Want to learn more? Check out our PrimeXBT review for a full rundown of what makes this the best Bitcoin futures platform for most traders.
PrimeXBT Pros & Cons
Pros
-
Futures trading on 150+ tokens with up to 400x leverage
-
Trade on multiple platforms including PXTrader 2.0
-
Cashback rewards and VIP tiers reduce trading fees
-
Negative balance protection and zero stop-out
-
Highly responsive 24/7 customer support
Cons
-
Requires full KYC to trade crypto futures
-
Limited selection of crypto-crypto futures pairs
-
Not available in all regions (sorry, USA friends)
MEXC – Top Bitcoin Futures Trading Platform for Pro Traders
MEXC isn’t trying to be flashy. It’s not pretending to be your favorite crypto brand. It’s just here to do one thing: give you access to hundreds of futures contracts and let you trade them like your portfolio owes you money. We can call it a no-frills crypto leverage trading platform without distractions.
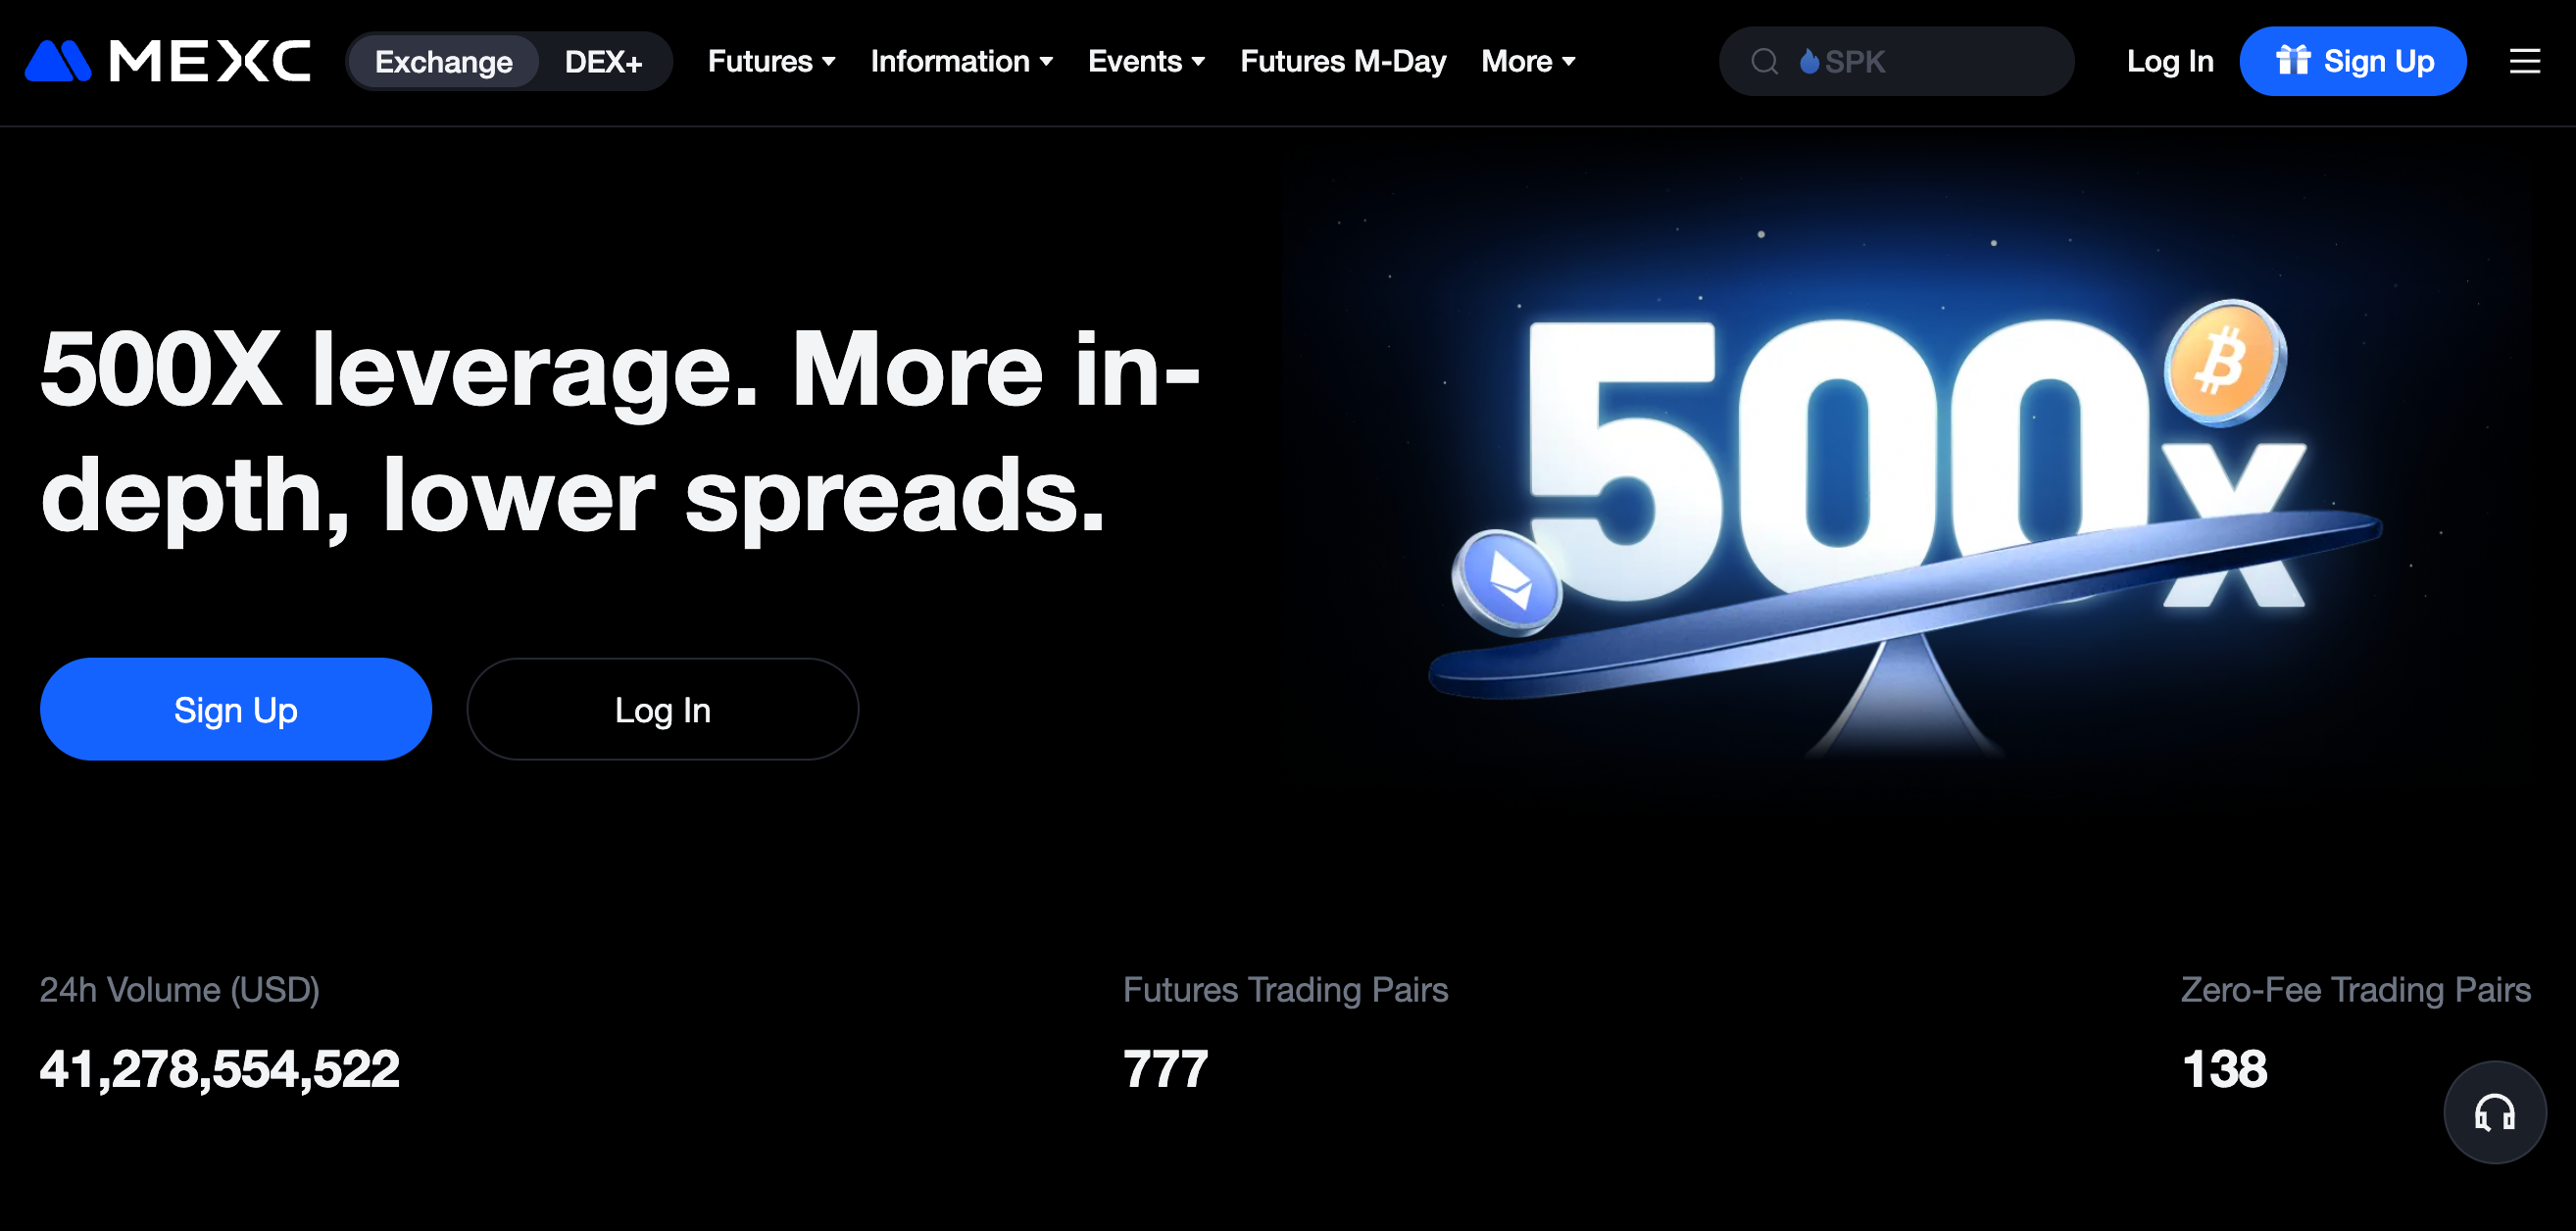
While most platforms are busy launching tokens and corporate sponsorships, MEXC quietly built one of the most liquid derivatives platforms in the world, especially for BTC futures, micro Bitcoin, and under-the-radar alt pairs. With over 500+ perpetual contracts and decent leverage options, MEXC gives you exposure to the majors and the obscure degenerates you saw trending on CT at 3 am.
Its onboarding is fast, KYC-optional in many regions, and the interface feels like Binance Lite minus the random feature creep. If you’re looking to trade Bitcoin futures with fewer distractions and more pair choices, MEXC’s where the quiet killers operate. Read more about it in our dedicated MEXC review.
MEXC Pros & Cons
Pros
-
Huge variety of perpetual contracts, Bitcoin, Ethereum, and 200+ altcoins
-
High leverage options available for most markets
-
Low fees and often better maker rebates than big exchanges
-
No mandatory KYC for spot and low-volume crypto futures trading platform
-
Solid mobile app with real-time market data and notifications
Cons
-
Less regulated than top-tier exchanges
-
Some markets have thin liquidity during off-hours
Coinbase – Best U.S. Futures Trading Platform
For U.S. crypto traders, there simply aren’t as many options for buying and selling futures. But Coinbase, long the largest U.S. exchange, recently rolled out futures and is doing a solid job competing with more lightly regulated international platforms.
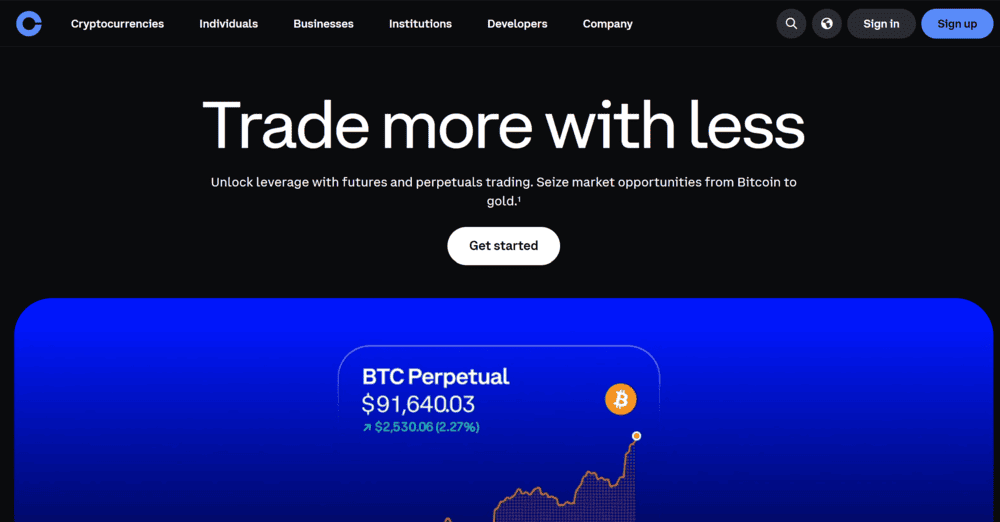
Coinbase offers Commodity and Futures Trading Commission (CFTC)-regulated futures on 15 of the biggest tokens, including BTC, ETH, XRP, SOL, DOGE, and more. Leverage is limited to 10x for Bitcoin, but that’s what you get when the CFTC is calling the shots. Contracts trade 24/7 and fees can get as low as 0.005% maker with volume discounts.
You get access to Coinbase’s proprietary trading platform, Coinbase Advanced, which was built with professional traders and institutions in mind. It’s feature-rich, including full access to the exchange’s order book and a complete order management suite.
You also get the benefit of trading with either USD or USDC and managing all your crypto positions—not just futures—from a single Coinbase app.
Coinbase Pros & Cons
Pros
-
CFTC-regulated crypto futures trading for U.S. traders
-
Trade with USD or USDC balances
-
Competitive futures trading fees with volume discounts
-
Highly trusted exchange with 24/7 customer support
Cons
-
Requires full KYC check to trade
-
Selection of crypto futures is very limited
-
Leverage limited to 10x or less (varies by token)
Bitbase – Top Futures Trading Platform for Emerging Tokens
Bitbase is another leading crypto futures trading platform with a lot to love. We picked it because of its enormous selection of perpetual futures contracts: more than 400 token pairs across USDT and USDC. That includes a huge variety of new and emerging tokens that aren’t available on other major futures trading platforms.
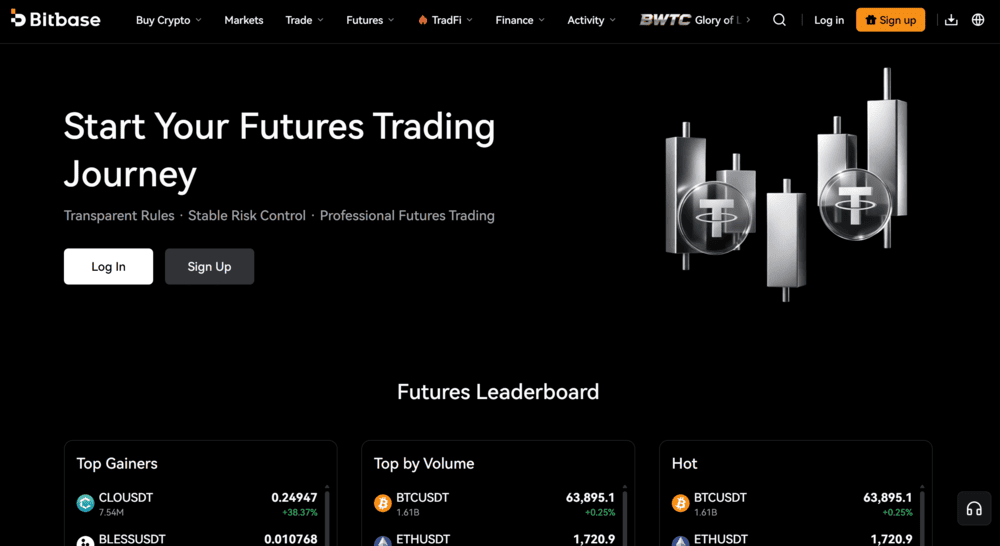
Bitbase also offers a smooth trading experience, with industry-leading liquidity and an ultra-fast order matching engine that cuts down on slippage. The proprietary trading platform is packed with advanced risk and position management tools. You also get full transparency into Bitbase’s order book and funding fees.
Futures trading fees are competitive, starting at 0.02% for makers and 0.06% for takers. Volume discounts are available, and you don’t have to worry about holding an exchange token to get the lowest rates at Bitbase.
Another reason to choose Bitbase? KYC isn’t required for most futures traders. There’s no limit on crypto deposits without KYC, and unverified users can withdraw up to $500,000 per day from the exchange. So, you can trade in privacy.
Bitbase Pros & Cons
Pros
-
400+ futures with leverage up to 150x leverage
-
Trade futures with USDT or USDC
-
Advanced trading platform with pro-level order management
-
Doesn’t require full KYC
Cons
-
Not available in the U.S.
-
Doesn’t offer copy trading or trading bots
-
Popular Bitcoin (BTC) Futures Trading Sites Compared
Choosing a Bitcoin futures trading platform is a lot like picking your fighter in a video game; they all have strengths, weaknesses, and hidden quirks that’ll either make you money or make you rage quit. Some give you perpetual contracts and flashy apps, others focus on old-school delivery futures with settlement dates and contract months that sound like you’re filing taxes.
To save you from hopping between 15 tabs and three YouTube reviews, here’s a quick look at how the top platforms compare on what actually matters: leverage, KYC, contract types, user experience, and whether you’re likely to get rekt or rewarded.
This isn’t one of those “we picked whatever showed up first on Google” kind of lists. Every platform on this list earned its spot by surviving a real vetting process, not just marketing fluff. We analyzed each Bitcoin futures trading platform based on a few critical metrics: Bitcoin futures are what happen when Wall Street suits and crypto degens both want to bet on the future but can’t agree on how risky is too risky. These are legally binding agreements to buy or sell Bitcoin at a predetermined price on a specific date in the future. You’re not buying actual BTC you’re trading on where you think the price is going. And unlike just holding spot, you can go long, short, or both if you’re feeling spicy. Traders use them for hedging, speculation, or just pure gambling. Institutions use them to manage Bitcoin price risk without touching the asset. And retail? Retail uses them to blow up accounts with 100x leverage in a 5-minute candle. As per CFTC, Futures contracts are standardized, time-limited contracts that convey the right to buy or sell the underlying asset at some point in the future. The contracts do not convey ownership in the asset itself. As contracts approach expiration, they must be settled or traded for new contracts. You’ve probably seen them on CME Group, Binance, OKX, and a dozen other platforms. Some are settled in cash, others in Bitcoin, some even offer micro Bitcoin or micro Ether futures so you can get wrecked slowly instead of all at once. The point is simple: you’re not buying Bitcoin, you’re buying price exposure, volatility, and a chance to be very right or very wrong, very fast. A Bitcoin futures contract is basically a handshake, except it’s digital, time-stamped, and backed by margin that can vanish faster than your favourite altcoin in a bear market. You and another trader agree to buy or sell Bitcoin at a set price on a specific date. These contracts are standardized and traded on exchanges like CME Group, PrimeXBT, and MEXC. That means no shady backroom deals everything is regulated (in theory), collateralized, and settled by smart systems (or by liquidation bots with no mercy). There are different types of contracts, each with their own quirks: Whether you’re a hedger trying to offset Bitcoin price risk, or a trader looking to build exotic trading strategies, futures contracts give you the flexibility to shape your risk, not just hold it. Trading Bitcoin futures is like betting on a horse race, except the horse is Bitcoin, the race never ends, and the track is on fire half the time. It’s the purest form of what is leverage trading crypto, and here’s how it actually works: You open a futures position by putting up margin, a chunk of capital that acts as collateral. Based on your margin and the leverage you choose (anywhere from 2x to 100x+), the exchange lets you control a much larger position. You don’t own the Bitcoin; you just control a contract tied to its price. You’re now exposed to Bitcoin price movements, amplified by leverage. If you go long and Bitcoin pumps, you profit. If it dumps, you bleed. If it moves sideways, you slowly lose to funding rates and spread fees, like financial death by papercuts. There are two ways these contracts end: Some contracts settle in cash (you get USD or Stablecoins), others settle in actual Bitcoin. On regulated venues like CME ClearPort, the process is clean and cold. On degen platforms? It’s a 24/7 battlefield of market data, risk calculations, and margin calls. The important part: you’re betting on time, leverage, and your own ability to not fold under pressure. Because spot is boring and the real action lives in the deep end. Bitcoin futures let you do things that spot can’t. Want to short Bitcoin during a bear market? Wondering how to short crypto? Good luck with that in a standard wallet. Futures let you profit when things crash, which, in crypto, is pretty often. Need to hedge your Bitcoin exposure ahead of the Bitcoin halving or a scary CPI print? Futures give you the flexibility to manage that risk without dumping your holdings. They’re also capital-efficient. With 10x leverage, you can control a $10,000 position with $1,000 of margin. That’s not just efficient, it’s aggressive. And if you’re building trading strategies, testing theories, or looking to exploit volatility around Bitcoin ETF news, there’s no better weapon than a futures contract. Institutions use them to manage billions without touching spot. Traders use them to chase the next move with precision. Degens use them because dopamine hits harder when you’re one candle away from liquidation. We have graduated from spot vs futures crypto discussion to Bitcoin futures vs options. Both futures and options give you exposure to Bitcoin price movements without owning the asset, but the mechanics couldn’t be more different. If Bitcoin futures are like a bet with a guaranteed outcome (profit or pain), then options are more like a bet you can back out of… for a price. Futures contracts obligate you to buy or sell at expiration, you’re in whether you like it or not. Options, on the other hand, give you the choice (but not the obligation) to buy or sell at a specific strike price. In exchange, you pay a premium up front, which can feel like paying for insurance you may never use. If you want straightforward exposure, leverage, and higher liquidity, go with futures. If you prefer hedging, playing volatility, and not getting liquidated every time Bitcoin wobbles, options might be your style. Here’s the head-to-head: Here’s how to get started trading futures on PrimeXBT: Head to PrimeXBT or download the app for iOS or Android. Users will need to register on PrimeXBT and pass KYC. The process is typically quite quick. Once your account is approved, users can send some USDT, ETH, or BTC to your wallet, buy crypto with fiat, or deposit fiat via bank transfer, debit card, or other methods. PrimeXBT is widely considered among the best for having the most funding options. Once your account is funded, traders head to the trading tab, where they can choose different spot trading products or futures contracts. Choose BTC, ETH, or a handful of altcoins. Long if you’re bullish. Short if you’re cold-blooded. Decide how much to bet and pick your leverage if you hate sleep and enjoy risk. Tap once to enter. Trades execute instantly. Watch your PnL, and close when you’re either in profit or sweating too hard. Trading Bitcoin futures isn’t about diamond hands, it’s about surviving long enough to actually cash out. Here are some battle-tested tips to help you make it past your first few trades without rage-deleting the app: Bitcoin futures aren’t for the faint of heart. They’re for the ones who stare at volatility and see opportunity. Who don’t just want to hold, they want to trade, hedge, speculate, and survive in a market where one wrong move costs you your ego and your margin. This isn’t spot trading. There are no participation trophies here. You’re leveraging conviction against chaos and whether you’re scalping perpetual contracts, hedging long-term bags with delivery futures, or dancing around funding fees on a Sunday night, you’re part of a system that rewards precision and punishes emotion. But if you respect the risk, study the game, and learn how to ride the waves instead of getting crushed by them, Bitcoin futures might just be the sharpest tool in your arsenal. So the question isn’t “should I trade Bitcoin futures?” It’s: Are you ready to take the other side of someone else’s bad bet, and win? Because in this market, someone’s always losing. Might as well not be you. DISCOVER: If it’s a delivery contract, it settles in BTC or cash based on the expiry date. If it’s cash-settled, your P&L is calculated and credited, and the contract closes automatically. Nope. You just need collateral, usually in USDT or another stablecoin, to open and maintain a position. It’s a futures contract with no expiration date. You can hold it forever (or until you get liquidated), and funding rates keep it pegged to spot price. Cash-settled contracts pay out in USD or stablecoins. Delivery contracts actually transfer Bitcoin at expiration assuming you last that long. Top platforms include PrimeXBT, MEXC, Coinbase, Bitbase, and regulated venues like CME Group. Depends on the platform, but sites such as PrimeXBT offer up to 400x. Note that leverage is risky. Yes. You can close any open position at any time whether you’re locking in profit, cutting a loss, or panicking. Some platforms let you start with as little as $1-10 using micro Bitcoin futures. Just don’t let the low bar fool you, the risk is real. Established in 2013, 99Bitcoin’s team members have been crypto experts since Bitcoin’s Early days. Weekly Research Monthly readers Expert contributors Crypto Projects Reviewed
Platform
Leverage
KYC Required
Futures Types
Best For
PrimeXBT
Up to 400x
Yes
Perpetuals (160+)
High-volume, pro traders
MEXC
Up to 500x
Optional
Perpetuals (200+ pairs)
Altcoin hunters, mid-level users
Coinbase
Up to 10x
Yes
CFTC-regulated perpetuals (15)
U.S. futures traders
Bitbase
Up to 150x
Optional
Perpetuals (400+)
Emerging tokens, advanced UX
How We Selected Top BTC Futures Trading Exchanges (Methodology)
What Are Bitcoin Futures?
What Are Bitcoin Futures Contracts?
Types of Bitcoin Futures Contracts
How Do Bitcoin Futures Work?
Pros & Cons of Trading Bitcoin Futures
Pros
Cons
Why Trade Bitcoin Futures?
Bitcoin Futures vs. Bitcoin Options
Feature
Bitcoin Futures
Bitcoin Options
Obligation to Execute
Yes
No (buyer has the right, not obligation)
Upfront Cost
Margin collateral only
Premium paid upfront
Risk of Liquidation
High (if price moves against you)
Limited to premium (for buyers)
Profit Potential
Unlimited (but double-edged)
Limited (for sellers), potentially high (for buyers)
Use Case
Speculation, hedging, arbitrage
Volatility plays, insurance, strategic hedging
Leverage
High (up to 1000x+)
Lower, depends on the platform
Liquidity
Very high (especially on PrimeXBT, MEXC)
Moderate to high, depending on strike/expiry
How to Start Trading Bitcoin Futures: Step-by-Step Guide
Head to the Official PrimeXBT Site or Download App
Create an Account
Deposit USDT, Crypto or Deposit Fiat
Enter The Trading Interface
Pick a Market & Direction
Set Your Stake & Leverage
Open and Monitor Your Trade
Tips For Trading Bitcoin Futures in 2026
Conclusion: Bitcoin Futures
FAQs
What happens when a Bitcoin futures contract expires?
![]()
Do I need to own Bitcoin to trade futures?
![]()
What is a perpetual contract?
![]()
What is the difference between cash-settled and delivery Bitcoin futures?
![]()
What platforms support Bitcoin futures trading?
![]()
How much leverage can I use when trading Bitcoin futures?
![]()
Can I close a Bitcoin futures position before it expires?
![]()
What’s the minimum amount needed to trade Bitcoin futures?
![]()
References
![]()
Why you can trust 99Bitcoins