 1 Comment
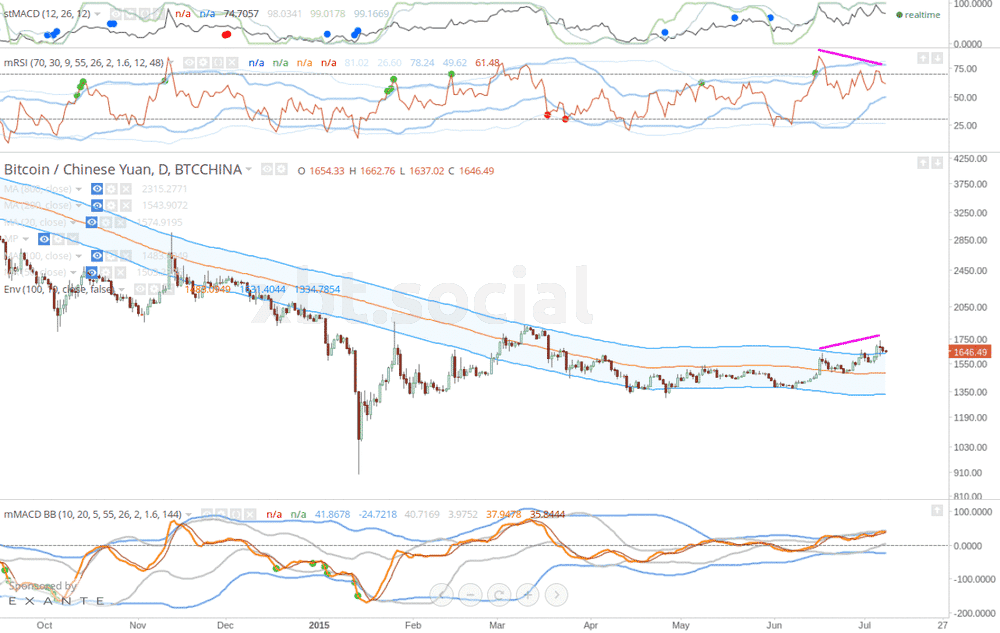
While the Greeks’ ‘no’ vote regarding a possible rescue deal for their debt crisis by European financial institutions put bond investors in a panic on Monday (6th July), the Bitcoin price soared to the upper 10% of the envelope of the 1-day 200MA to $275 and 1700 CNY.
Bitcoin investors were wondering whether the price will keep rising or make a downward curve after the Greek hype. Technical indications in the Bitcoin price chart and global markets might give an indication of the direction BTC prices are heading.
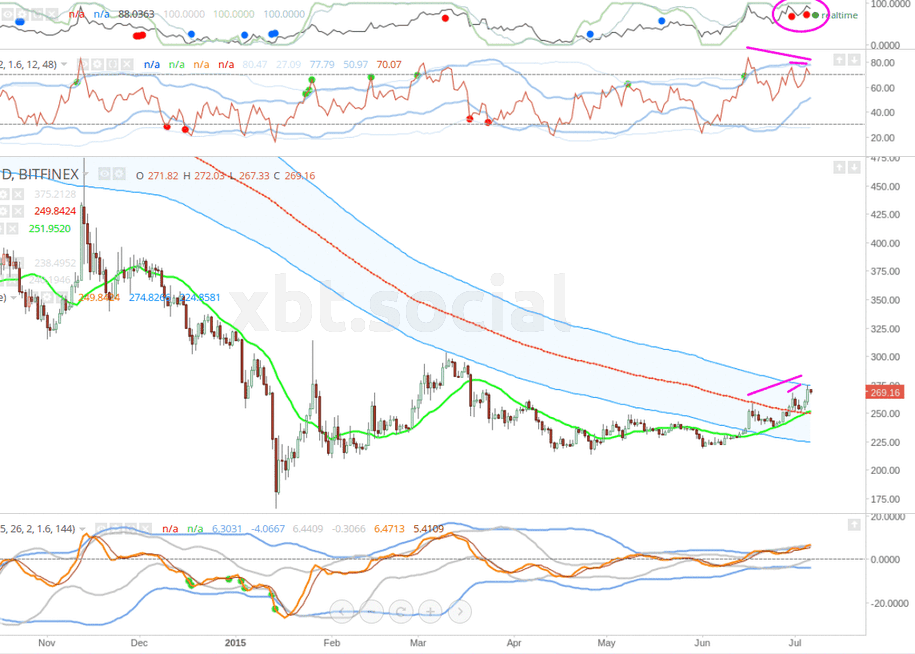
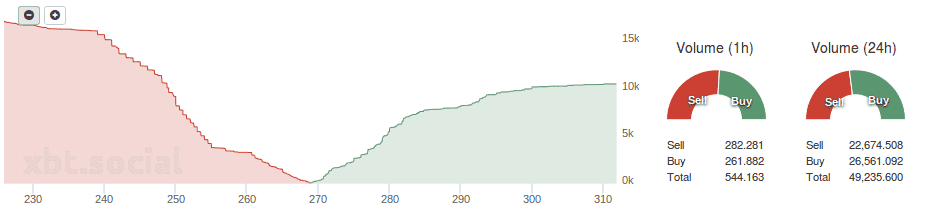
It was suspected that, with the RSI and double stochastic divergence compounding, prices might fall. Although MACD was not confirming a downward movement, the fact that this might become a reality was shown by the decreasing trading volume. The stochastic were also currently showing a very high overbought, which in the past had been an indication of wave highs and lows.
Also, it was suspected that the market reaction to the European trading session could alter this analysis. Gaps down in equities, as well as the Euro forex pairs, had been observed, but investors were slowly closing these gaps.
Besides, the fact that gold had made a smaller advance on the referendum outcome could also be influencing the current Bitcoin position.
On Tuesday (7th July), the price kept rising at first, but it predictively dropped below $270 and it was likely to drop even further to a three wave decline. Interestingly, the RSI regular divergence did not repeat a previous occurrence of reverse divergence.
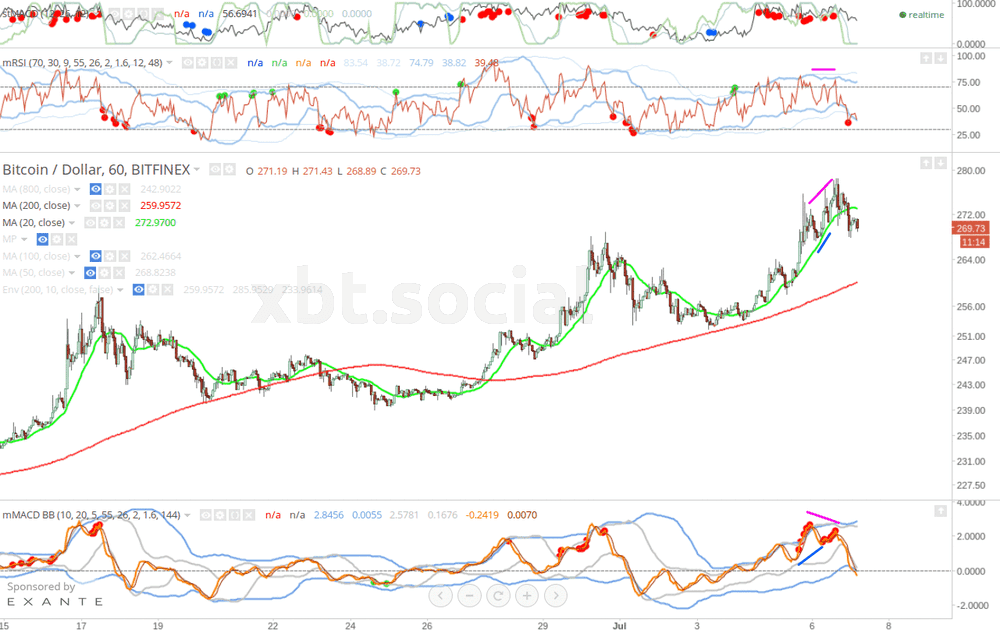
On 8th July it was clear that the Greek referendum had caused the Bitcoin price to get stuck between two converging envelope lines at approximately $265 and 1650 CNY. This meant that the price would wind sideways between the lines until it “chose” a direction.
Depending on the direction to be selected there could either be an advance, where the price could make a sudden break toward the 1-day 200 MA; or a decline, where the price could drop through the 100MA 10% envelope below. At that moment, a decline was not good news for investors trying to short the decline.
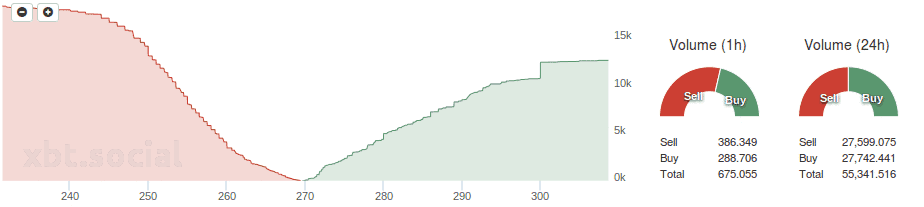
However, it could be a good way of building a long position. Although the Bitcoin price had declined more rapidly than expected, the distance was not greater and it had not yet reached the upper envelope line of exchange charts. It could be expected that the market would test the level at about $262 and 1630 CNY.
The RSI indicator had also diverged to the advancing price wave. However, the MACD did not confirm this, nor did the stochastic indicator. This could be an indication that the wave was tending upwards again.
On 9th July the direction of the Bitcoin price was still looking very uncertain at $267 and 1672 CNY. However, it was possible that the most recent price high might just yet touch the upper blue trend line.
Although one more declining wave was not plausible, the chart still had room for one more. With the challenges facing the Euro Zone, the China equities crash and the problems with regard to the New York Stock Exchange, the advances weren’t showing much more momentum and volumes than the decline.
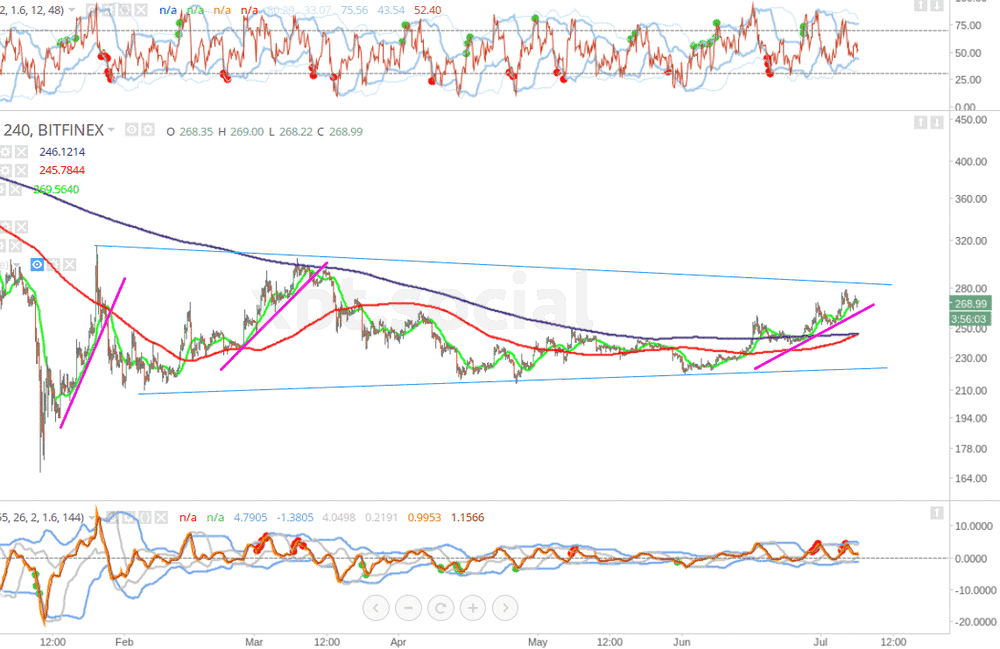
On 10th July the Bitcoin price had reached a high of $280 and 1740 CNY. The bottom MACD had settled on its zero line, while the Bollinger Bands were contracting. The top RSI had smaller amplitude and was hovering in the middle of its range. Bitcoin’s price seemed to be slowly rising by 20MA toward 200MA.
There was a possibility for a fake-out, which could have gone either way. Prices could have dropped into a final corrective wave before resuming an advance. However, investors were advised not to be overly cautious, since this could be a great investing opportunity.
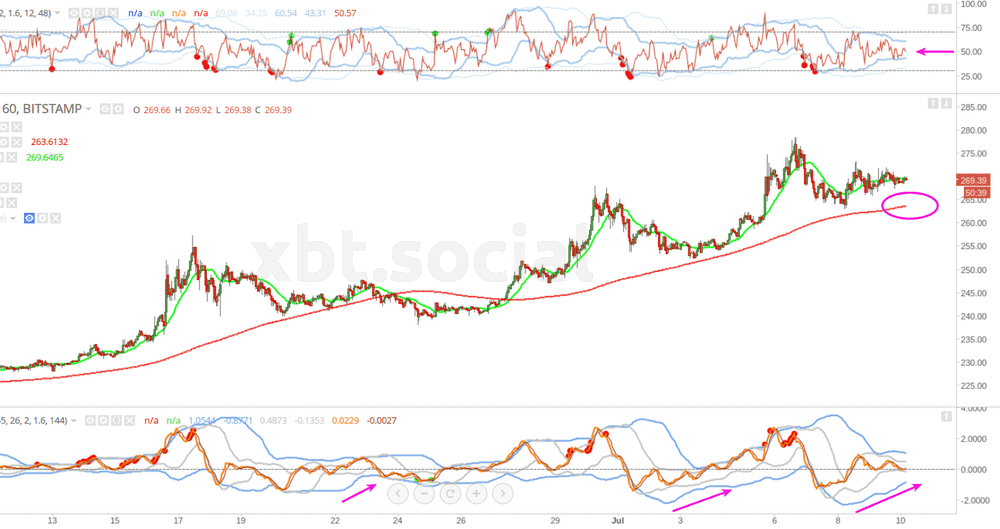
Chart source: BFXDATA & xbt.social


10 July 2015 – Analysis – Avg Precision 1.5 % – 11 days Ahead – https://bitcointalk.org/index.php?topic=338427.msg11843720#msg11843720