 16 Comments
TL;DR version of How to Trade Bitcoin:
- You can use Bitcoin’s volatility to trade Bitcoin CFDs without owning actual Bitcoins through companies like Plus500, Avatrade and Fortrade.
- This type of trading is risky and you should start out in demo mode until you feel comfortable enough you can generate consistent profits.
- In order to make profitable trades you need to learn how to gauge the market. This requires time and experience. Even though this article provides an extensive overview, you will need to start experimenting with your own trades and continue to learn before becoming successful.
Part 1 – Introduction to Bitcoin trading
Let’s be honest, Bitcoin has a steep learning curve. It takes a newcomer about 3 months of reading just to get up to speed on Bitcoin’s basics. And like anything new and revolutionary, Bitcoin doesn’t fit with established ways of doing things. Understandably, not everyone has the time, inclination or risk appetite to get deeply involved with Bitcoin.
On the flipside, anyone who’s heard about Bitcoin knows that involvement with it can be immensely profitable. A glance at financial media over the past few years was enough to make anyone regret missing Bitcoin’s early days. From virtually free tokens in 2009 to a new $1000+ asset class in 2013, there’s no question that Bitcoin made multi-millionaires of particularly lucky, daring or brilliant people. The possibility of such outsized returns makes Bitcoin attractive despite its learning curve – particularly in an economy in which many other asset classes are struggling.
So, from this point of view, there are two types of people: 1) those who already have Bitcoin and know how to trade it and 2) those who want Bitcoin but bounce off its technical complexity.
The purpose of this article is to show this second group of people a straightforward, familiar method to take profit from Bitcoin’s price moves… without having to understand Satoshi’s blockchain, Bitcoin mining, segregated witness or any other such arcana.
Thanks to the inclusion of Bitcoin as a tradable instrument by certain major international online exchanges, anyone who can read a price chart can now trade Bitcoin. To profit from Bitcoin’s often wild price moves, it’s no longer necessary to install any applications or read a single Wiki page. With the technical barriers to entry finally lifted, Bitcoin trading becomes a lot more accessible.
Why Trade Bitcoin Over Other Instruments?
Bitcoin is Global and Always Available
First, Bitcoin trading is global, distributed across electronic exchanges around the world. The Bitcoin market never closes, so if money never sleeps then Bitcoin is the purest form of money. Unlike Forex, Bitcoin doesn’t take weekends off. This means that online traders just about anywhere in the world can now dip into the Bitcoin market whenever it’s convenient to them, whether that’s outside of business hours or over weekends and holidays.
Bitcoin Volatility is a Trader’s Dream
Second, Bitcoin is known for its high volatility. A 3% daily move is unexceptional for Bitcoin and, during particularly volatile periods, price sometimes exhibits double digit percentage moves. When traded correctly, such swings can be extremely profitable over short timeframes. The more price moves, the more profit can be made trading both the upswings and downswings.
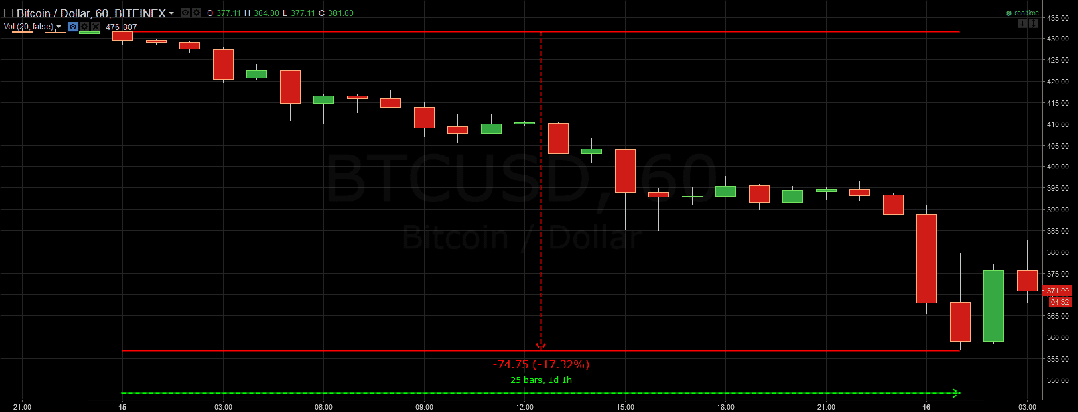
In mid-January 2016, Bitcoin price moved over 17% in just over 24 hours – only a medium-sized move for Bitcoin!
Bitcoin can be Leveraged by Individual Traders
Third, Bitcoin can be traded with leverage (keep in mind that CFDs are leveraged products and can result in the loss of your capital). This allows traders to generate monetary returns well beyond their proportional investment of trading capital. Put more simply, on platforms like Plus500, every $200 let you trade about $2500 worth of Bitcoin… Granted, most other trading instruments have similar leverage functionality.
However, when combined with Bitcoin’s constant availability and high volatility, this leverage really opens the door for individual traders. Distinct from highly-capitalised institutional or professional traders, for whom trading is a day-to-day business, individual traders tend to have limited free time and limited capital to keep tied up in a trading account. Compared to other instruments, leveraged Bitcoin trading can give the best bang for the buck over the shortest timeframe.
Bitcoin Seldom Trades in Lockstep with Other Instruments
Fourth, Bitcoin is undeniably unique. There’s no commodity or currency quite like it – it’s the world’s first widely-traded digital commodity and a programmable currency with predictable inflation. As a result, Bitcoin price generally moves independently of Forex, stock, bond and commodity markets. Bitcoin, as a global network, is also somewhat insulated from localised risks. This independent quality substantially reduces the importance of external news flow (and other market noise) to Bitcoin traders.
Although developments within the Bitcoin space can and often do impact price, such market-moving events tend to be rare. Examples include the Cyprus bank bail-in and regulatory changes to Bitcoin’s legal status or increased capital controls in China. As major external factors which roil other markets are usually less significant to Bitcoin, it’s easier to trade based on pure price action and technical analysis.
For those who are just starting out with trading, technical analysis a methodology for forecasting the direction of prices through the study of past market data, primarily price and volume. So there’s no need to catch every data release, analyse major corporate events or to try to interpret any more vaguely-worded central bank pronouncements in order to try and predict Bitcoin’s price.
To sum up, access to Bitcoin as a trading instrument means you’ll always have a lively market to trade. And there’s one more good reason to trade Bitcoin without using Bitcoin…
A Good Tax Reason to Trade Bitcoin with Regular Money
When it comes to trading Bitcoin’s price using Dollars, Yuan, Euros or any other national currency, there are no unwelcome surprises in store from the taxman. Although you’ll gain exposure to Bitcoin’s energetic price movements, all profits or losses will be denominated in traditional currencies. Likewise, deposits to the exchange and withdrawals from the exchange will be in fiat currency.
Unlike Bitcoin transmissions and earnings, all the legislation which pertains to fiat trading is well-established and widely-understood. As a result, traders who avoid direct interaction with Bitcoin will require no specialist tax advice in order to remain compliant.
So far for the good news, and now…
The Disadvantage of Trading Bitcoin without Owning or Understanding It
Unless you have a good basic understanding of Bitcoin, you’ll be reliant on others to explain the significance of major events. This can lead to confusion and indecision when market-moving news comes out.
Buying and spending some Bitcoin, even in trivial amounts, is often the best introduction to the system (you can check out our guides to various methods of earning or acquiring Bitcoin). There are also numerous learning resources for getting acquainted with the inner workings of Bitcoin, such as its Wiki page and this video series from Khan Academy. If you have any follow-up questions, most Bitcoiners will happily to answer them. Check out Stack Exchange, the BitcoinTalk forum, #bitcoin on IRC or Reddit’s r/bitcoin “Mentor Monday” threads.
Part 2 – How to Trade Bitcoin with Regular Money
Now that we’ve explained the advantages and disadvantages, it’s time explain how to trade Bitcoin using purely fiat means.
Getting Started with Contracts For Differences (CFDs)
Bitcoin CFDs are the magic which allows you to trade Bitcoin without using Bitcoin. They were originally created for the purpose of gaining exposure to Bitcoin without the necessity of owning it.
As the name implies, a Contracts For Differences represents a contract between trader and exchange. Such contracts declare that the difference between the trader’s entry and exit price shall be the trader’s profit or loss. So basically it’s just an agreement which is held between the two parties simulating as if the actual asset (i.e. Bitcoin) is being held by the trader.
Advantages of Contracts For Differences
CFDs are flexible in that they allow traders to go long (which is to bet that price will rise) or go short (which is to bet that price will fall). When using CFDs to trade Bitcoin, trades may be entered on any day, at any time, and likewise closed whenever.
CFDs also have the advantage of low fees relative to other methods of trading markets. Note however that these fees are slightly above those of exchanges which facilitate the direct purchase and sale of bitcoins (e.g. Bitstamp, Kraken, etc.).
For example, In addition to daily interest on open positions, Plus500’s fees are taken from the spread (The difference between the “buy” and the “sell” price of a security or asset.). This means clients pay slightly more than the current Bitcoin spot price to buy a contract and receive slightly below the current value when selling.
Disadvantages of Contracts For Differences
It must be clearly stated that, while CFDs are suitable for traders, they are not the ideal choice for long-term holders. There is a cost to maintain an open trade using CFDs. This cost is sometimes known as a Premium and consumes 0.1% of your position daily. As leverage on a CFD is enabled through a loan made from exchange to trader, interest must be charged for the duration of this financing arrangement. By contrast, bitcoins you own may be held in a digital wallet for any length of time at no cost.
A further disadvantage of CFDs is the dreaded “margin call.” Due to the financing arrangement described above, exchanges must protect themselves against unexpected, drastic market moves – so-called black swan events – which place client balances into the deep negative figures. When leverage is high, markets are volatile and the pace of trading is frenetic, such negative balances are a considerable risk.
Although such losses become the liabilities of clients, if clients are unable to cover them then the exchange itself will suffer financial losses. Exchanges have gone bankrupt for this reason. To mitigate this risk, exchanges automatically close out clients before their balances become negative; this is referred to as a margin-call. Simply put it’s the act of the exchange closing your trade because you didn’t have enough money to cover your loss.
The better-funded a client’s margin account, the less likely a margin call becomes. Amid market volatility, traders with too-thin margin buffers may well find themselves knocked out of a trade at a loss. Margin calls are especially galling when they occur on trades which would otherwise have proven profitable.
Last but not least, trading CFDs requires regulation, and today many companies avoid operating in US because of the regulation costs. This means that at the time of writing this article it’s still impossible to find a regulated CFD broker in the states. Since I know most of this blog’s readers are from the USA I thought this was worth mentioning. However, this article related to general Bitcoin trading and not just CFD trading so feel free to read on.
You can always experiment with CFDs risk-free
Plus500 and many other Bitcoin CFD borkers (e.g. Avatrade, Fortrade) offer a demo trading program which mimics their regular trading interface. The real-time Bitcoin price and the workings of the CFDs are real but your trading account is automatically filled with simulated money. You may use the demo for as long as you like, until you’re ready to trade with real money.
I’ve chosen plus500 as the example for this post just because it’s the simplest trading platform available IMO. However most other Bitcoin CFD brokers offer the same features. In the following lines I’ll explain how you can open your demo trading account.
Step 1: Download and Install the Plus500 Demo
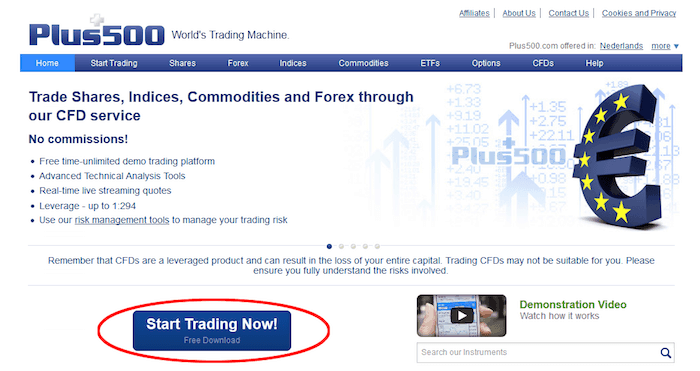
Now that you’re informed as to the benefits and risks of Bitcoin CFDs, it’s time to practice trading Bitcoin! Head over to Plus500’s website and click the “Start Trading Now!” button.
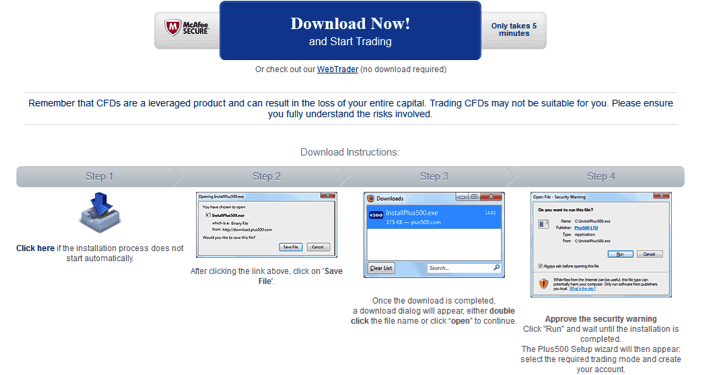
Next, hit the “Download Now!” button and then follow the 4 steps under “Download Instructions.”
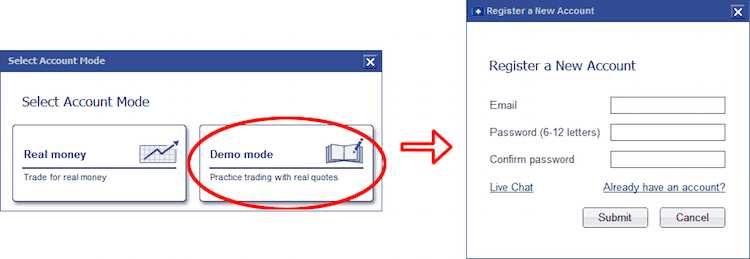
When the application has installed, run it and select Demo Mode and then register as a new user. You’ll be requested to enter an email address and password, make sure you record this information for future sign-in purposes.
Warning: Traders new to CFDs should remain in Demo mode until they fully understand all significant aspects of these contracts. Newcomers to trading should stick with Demo mode until the profitability of their intended trading method is demonstrated over time. Unless fairly consistent profits can be achieved in simulated trading, there’s no chance of success using real money! The possibility of real financial profit and loss introduces consequences which greatly increase the psychological difficulty of trading.
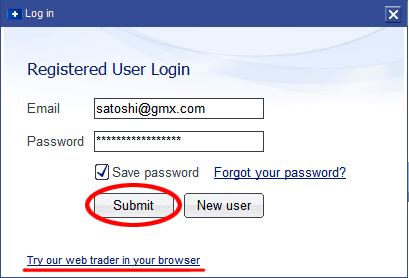
Step 2: Log In
On the sign-in panel, you may elect to use the application you just downloaded to your hard-drive by entering your email and password and clicking Submit. To demo-trade through Plus500’s identical online trading app, instead click the “Try our web trader in your browser” link.
Step 3: Locate and Examine Bitcoin CFDs
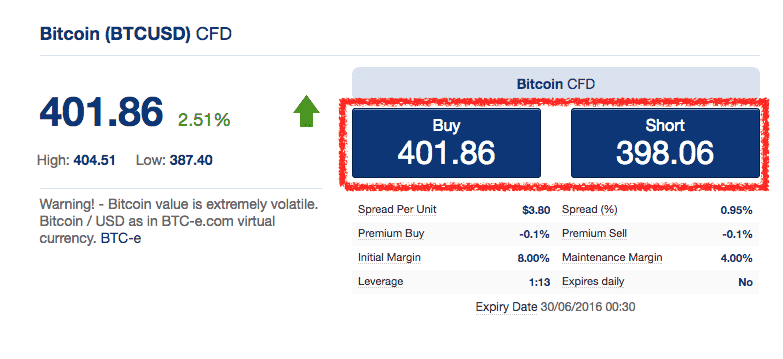
Navigate to Forex > Virtual in the leftmost pane or alternately, enter “bitcoin” into the search field at the top of the same pane. When Bitcoin appears in the Instrument pane, click the Details link to display important information on Bitcoin CFDs. Hovering over the “?” icons will display tooltips with further information on each item.
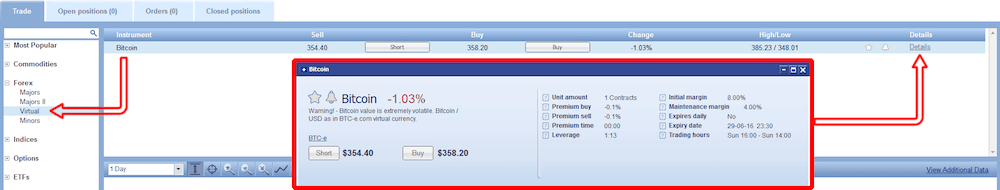
What the Details panel indicates is that a 0.1% charge applies daily (at midnight, your local time) to each Bitcoin contract you own, whether trading long or short. Your money is leveraged 13 times, which means that for every $1 the underlying Bitcoin price moves, the value of each contract you hold will move $13.
The initial margin is the percentage of your position’s total value required in your account to open the trade; in this case the exchange requires you to have 8% of the value on deposit. The maintenance margin is the percentage required to keep your trade open. Note that if your position falls in value your initial margin may quickly fall below your maintenance margin, resulting in a margin call (closing of the trade).
Finally, the contract expires in mid-June of 2016. Any position you maintain until then will be automatically closed out.
Step 4: How to Buy and Sell
Once the contract is well-understood, it’s time to get down to the “actual” trading. In either the Instrument or Detail pane, click Short or Buy depending on whether you believe price will rise or fall.
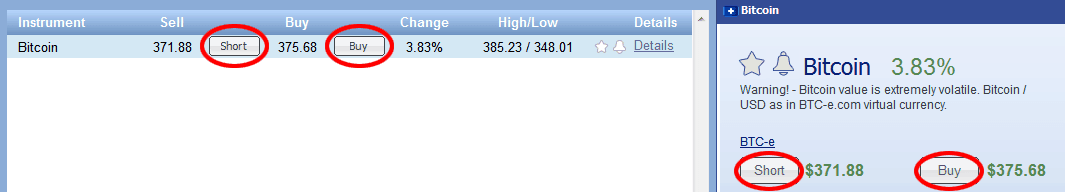
Now it’s time to structure and enter your trade. Note that trying to Sell more Bitcoin contracts than you own will create a short position. In order to close a short position, you will need to Buy the equivalent number of contracts.
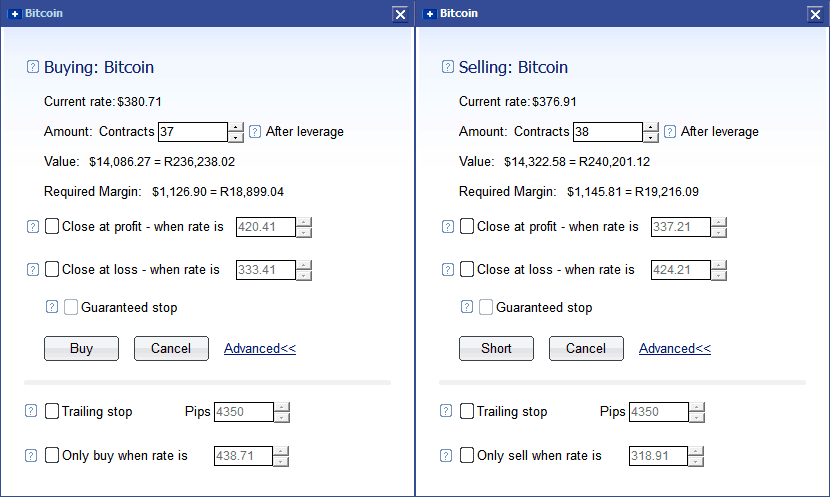
The app will calculate the current value of the number of contracts selected and convert that value to your local currency. It will also calculate and convert the necessary Initial Margin.
The Close at profit and Close at loss options may be ticked and set to create a profit target and stop loss, respectively. The app will automatically close your position when Bitcoin price reaches these levels. This allows you to automate profit-taking on good trades and, more importantly, limit your losses on bad trades. The Guaranteed stop option ensures that if price drops below your stop-loss level, the trade will be closed. This is possible with CFDs but not always possible in real, highly-volatile markets in which price may gap.
The Trailing Stop option is good for when price is trending. A Trailing stop means that the stop-loss price is not set at a single, absolute dollar amount, but instead is set at a certain percentage or a certain dollar amount below the market price.
Should price reverse and move against your chosen direction, the trade will be automatically closed based on the number of “Pips” you select. Pips is a Forex term referring to four decimal places but don’t worry about that – simply use the arrows or number field to enter a value and the extent of the trailing stop will be displayed as a percentage.
Finally, the Only buy / sell when rate is [x] option allows you to automatically enter a long or short trade only once Bitcoin price reaches a certain level.
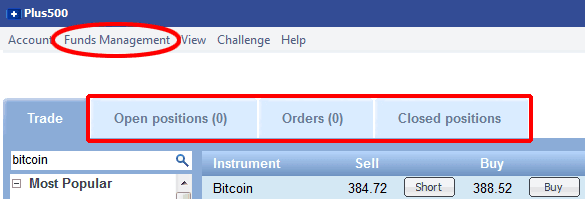
Step 5: Check Open Positions, Orders, Closed Positions and Balance
The history and status of your market positions can be easily accessed from the 3 tabs along the top of the trading interface. Your account balance and details may be accessed from the Funds Management menu on the toolbar.
Step 6: Examine Other Major Features
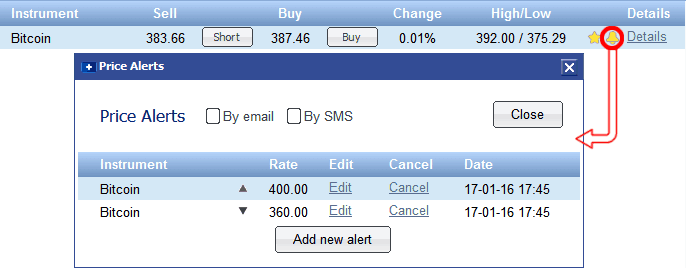
Clicking the bell icon next to the Details link allows you to enable the Price Alert feature. This handy alert will email or SMS you when a particular Bitcoin price point is reached.
Step 7: Fund Your Account
When you’re ready for Real money trading, the options to fund your Plus500 account include:
Visa, MasterCard, Maestro, Diner’s Club International, PayPal and Skrill.
The Risks of Trading
Although Plus500 makes it simple to trade Bitcoin, trading remains a high-risk and difficult proposition. So although Bitcoin trading can bring in high returns, it’s by no means easy money!
Breaking Even
Consider that when trading CFDs, one takes an immediate loss when opening the position. This loss is the difference between Bitcoin’s current spot price (i.e. market price) and the prices offered by the exchange, known as the “spread.” Simply to break even on a trade, Bitcoin price will have to move some appreciable distance in the trader’s chosen direction in order to cover for the spread.
To better illustrate this, imagine opening a position by buying Bitcoins and then instantly closing that position. If this occurs you’ll actually lose the difference between that “buy” and “sell” price.
The Challenge of Markets
Imagine an environment in which consequences were unpredictable; throw a dart and maybe it follows the laws of physics or maybe it flies right through the dartboard and wall. Or maybe the dart transforms into a giant wasp which attacks you. Dealing with the unpredictability of markets is no mean feat.
Not only are markets unpredictable but they’re also ruthlessly competitive. It’s like playing dream-darts against a host of skilled opponents, some of whom have major resource and informational advantages. Newcomers are wading into deep, shark-filled waters. Sticking with Demo mode until you prove your ability to survive is the only sensible course.
Learning to survive markets requires you to develop discipline, patience and skill. There’s simply no substitute for study and practice – expect to spend countless hours paper-trading (i.e. demo trading) the market until you’re ready to trade it for real. While you practice, maintain a trading journal in which you record every relevant aspect of each trade, including your mood.
Exchange Risk
It must also be borne in mind that entrusting funds to any exchange carries some measure of custodial risk. This is true whether the exchange allows direct trading of Bitcoin or offers Bitcoin derivative products. Always investigate an exchange’s reputation and policies before entrusting funds to them. Somewhat counter-intuitively, exchanges with higher margin requirements are often the better choice as they’re better protected against black swan market events. Among the top tier of CFD platforms which allow Bitcoin trading, such as Plus500 and AvaTrade, you’ll find margin requirements (and fees) very similar.
Part 3 – How to Chart Bitcoin for CFD Trading
Let’s begin with the basics of reading price over a single time period:
Candlesticks
Using so-called candlesticks to chart prices began in 19th century Japanese rice markets. This method remains valid when representing modern-day cryptocurrencies. Candlesticks are the default format for serious price charts, although simple line charts can serve when precision is unnecessary. Candlesticks display all critical information in a simple way:
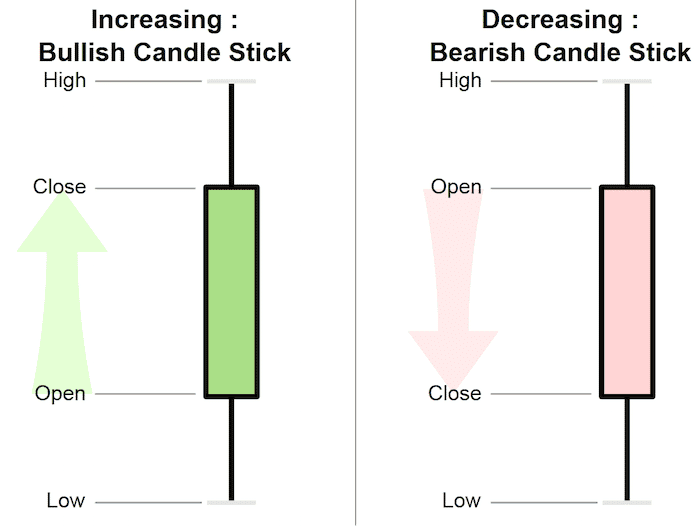
Green and red are the standard colours indicating up or down movement.
Alternately, an empty candle body is interpreted as “up” and a filled body as “down.”
Certain candlestick formations or sequences are considered to have predictive value (for help in identifying such candlestick patterns, consult Bulkowski’s Visual Candlestick Index).
Charting Apps
Although Plus500’s trading app features a live price chart with customisable indicators (to add indicators, click the f(x) icon, select an indicator and, if necessary, adjust its default parameters), it’s fairly barebones. While Plus500’s charts are certainly good enough to monitor your trades, they’re perhaps not quite equal to the task of planning them. For one thing, the amount of visible trading data is limited in each timeframe. For example, 1 Day trading data only goes back to December 2014. For a more comprehensive view, it’s necessary to switch to weekly data.
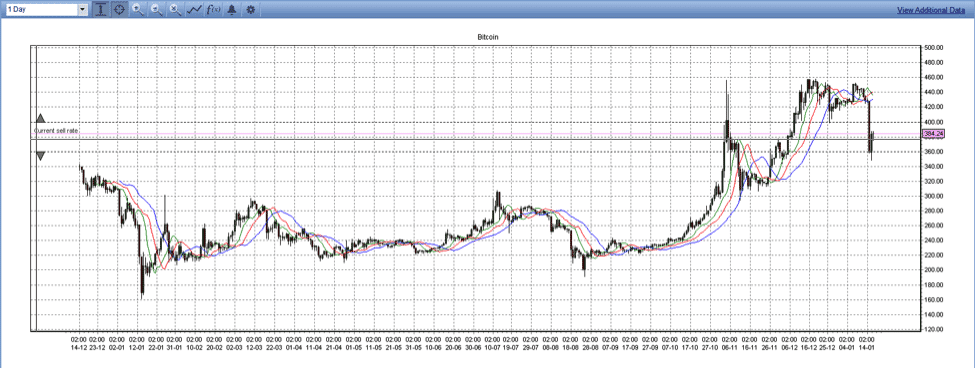
Plus500’s live daily chart of Bitcoin which, like all price charts, shows price (Y-axis) over time (X-axis).
Note that while indicators (mathematical functions which reveal information derived from time, price and/or volume data in a visual format) can be applied, annotation (that is, adding lines and text) is impossible.
Particularly if you’re unfamiliar with Bitcoin, technical analysis will likely be the foundation of your trading approach. The assumption being; that Bitcoin’s bewildering technical complexity is distilled via the market to a single, simple essence: price. As such, it’s important to have the best tools and data at your disposal for charting price.
Trading View offers free access to fully-featured Bitcoin (and others) charts, with data derived from several different exchanges and a host of standard and custom indicators. It’s even possible to script your own indicators and to combine data feeds from various instruments into the same chart or price-stream, as well as to conduct simulated trading through their interface.
Trading View also allows full customisation and annotation of charts – and if you’re going to pore over Bitcoin charts for hours on ends then it’s important that they convey all the information you need at a glance. With Trading View, you can also draw all manner of lines, patterns and price levels over your charts. Such visual tools are often vital to good charting, so their absence from Plus500’s charts is notable.
Trading View charts may also be saved for future reference or shared with the community to invite feedback. This is a great way to test out your trading ideas and record market perspectives.
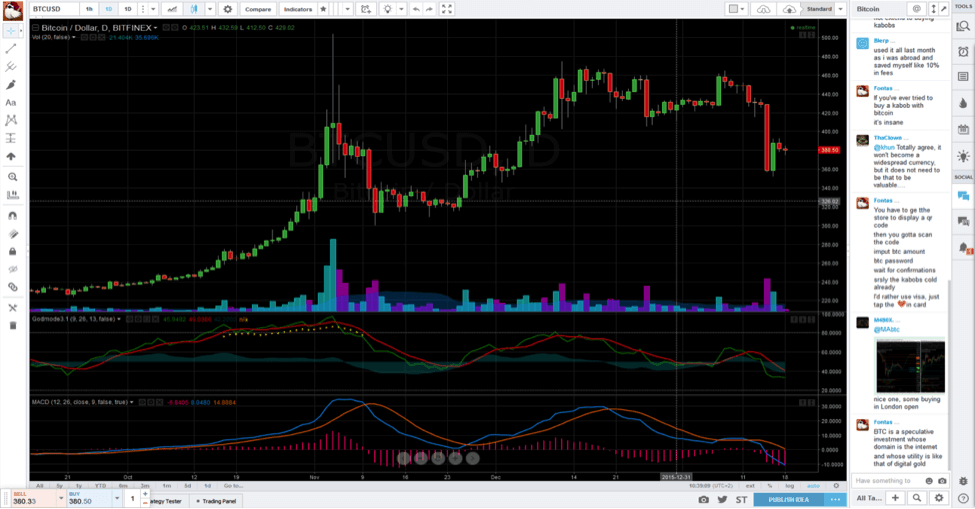
Trading View offers just about everything you could want from charting software, although you do have to create an account. Certain advanced features require a paid subscription. Note the two indicators and the volume bars below the daily price candles – volume simply records the number of bitcoins traded over a time period.
In short, you’ll likely want to expand your trading toolkit with supplemental charts, either from Trading View or other specialist charting sites like Bitcoin Wisdom.
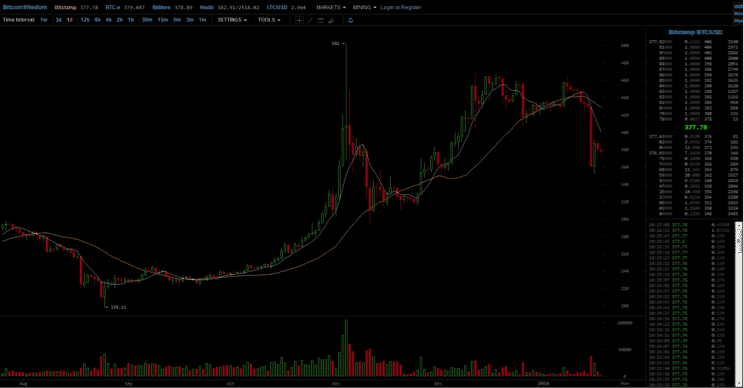
Bitcoin Wisdom charts have the advantage of displaying the order book and last trades (in the rightmost block).
This live data is available for 14 major Bitcoin exchanges around the world and may be of use to short-term traders. Standard indicators and limited annotation features are also available through Bitcoin Wisdom.
Part 4 – What Type of Bitcoin Trader Are You?
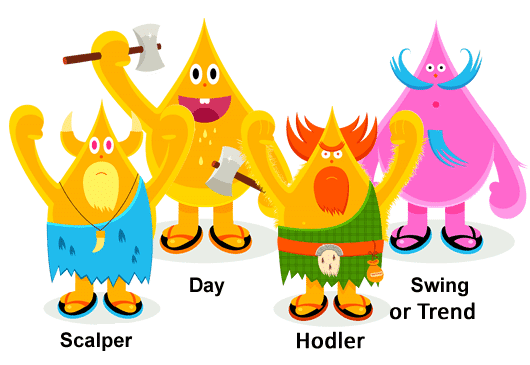
Image credit: BabyPips.com – a great learning resource for aspiring Forex traders with much applicability to Bitcoin.
If you’ve decided to trade Bitcoin using CFDs, you’ve already partially answered this question. Other major factors to consider are:
- Your preferred timeframe.
- Whether you trade trending markets (A market that is trending in one direction or another) or ranging markets (when the price of Bitcoin is making the same highs and lows a number of times) or both.
- Your personal trading style, as defined by the trading signals you follow.
Timeframes
In order from longest to shortest timeframe, trading strategies are broadly defined as follows:
1) Buy and Hold
Often referred to as “hodlers” (sic) in the Bitcoin community, buy and hold proponents take the long view. They consider Bitcoin price in terms of monthly, weekly and occasionally daily charts. Distinct from traders, their goal is to accumulate the largest possible quantity of Bitcoin as they expect it to become extremely valuable in future.
There is some justification for this view, due to Bitcoin’s superior monetary utility, limited supply (of 21 million coins) and inherent advantages over fiat currencies. Hodlers tend to base their actions more on fundamental analysis than on technical analysis, which is to say hodlers act on their assessment of Bitcoin’s economic potential rather than chart patterns and the like.
Holders are insensitive to daily price fluctuations. Some holders are un-phased even by extreme price moves, particularly those who’ve experienced several bubbles during Bitcoin’s history. Holders tend to view price crashes as an opportunity to acquire more coins at a discounted price. They may take profits if they believe price has reached an unsustainable peak although they’re unlikely to liquidate their entire position.
As briefly mentioned above, Buy and Hold is not a strategy which aligns well with CFDs. The primary problem is that the daily Premium, required to hold CFDs, is an unnecessary and unjustifiable expense over the long term. The secondary problem stems from the increased risk of keeping one’s (simulated) bitcoins on an exchange, as opposed to keeping real bitcoins under one’s personal control in a cold or hardware wallet.
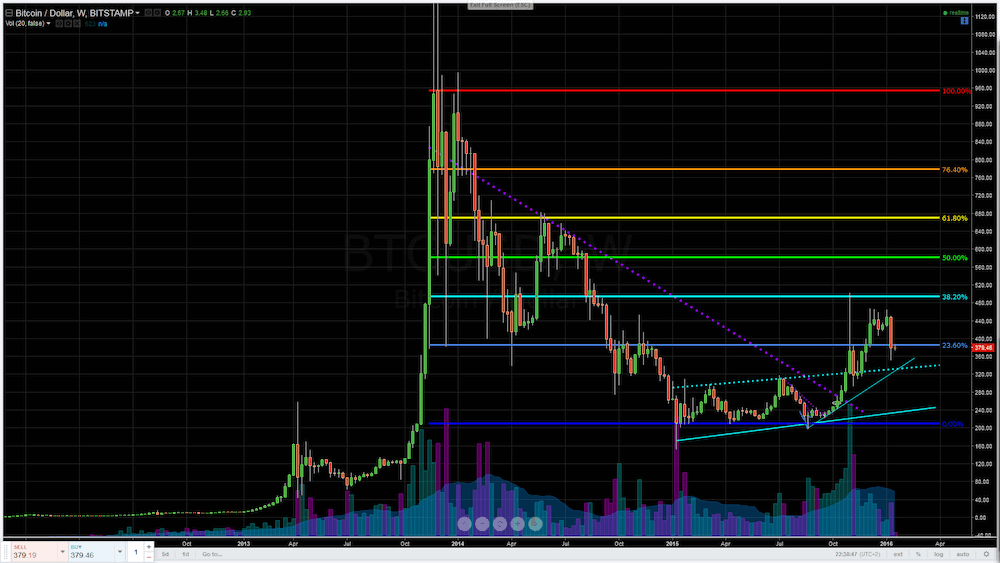
A weekly timeframe (where each red or green bar, or “candle,” represents one week) showing the BTCUSD (Bitcoin to US Dollar) exchange rate over several years.
2) Swing Trading
A swing trader typically maintains a position for a few days to several months. Their strategy is to trade significant price moves between two extremes. When price isn’t following a strong upwards (often called “bullish”) or downwards (often called “bearish”) trend, it tends to range between a high and a low price. These are the levels at which buyers or sellers reliably enter the market in volume, with the result that price direction reverses. Bitcoin price may remain within such levels for extended periods, as it did for much of 2015 when it shuttled between the low two- and three hundred dollar levels.
In addition to price levels they consider likely reversal points, swing traders often rely on technical indicators which reveal oversold or overbought market conditions (these somewhat self-explanatory terms indicate that market sentiment and momentum has become unbalanced and is due to correct). Indicators frequently employed by swing traders include: Bollinger Bands, the RSI (Relative Strength Index) and the Stochastic Oscillator.
When Bitcoin price reaches a likely reversal level, swing traders will bet on a price reversal, particularly when such indicators confirm the likelihood of a change in direction. Should price continue rather than reversing, this is a clear signal to exit the trade at a small loss.
Swing trading is a strategy which aligns extremely well with CFDs. The timeframe is a good match and larger price moves will amply compensate for the spread and Premium. Also note that the Close at profit and Close at loss options, available when buying or selling through Plus500, can be used to great effect when making such trades.
If price continues through the expected reversal point, it should be closed at (a minor) loss. If price behaves as anticipated, close at (a major) profit when the next anticipated reversal point is reached. The reverse trade may then be placed. Note that it’s often wise to wait for a confirmed reversal – if price continues on then it’s best to follow the trend, as covered below…
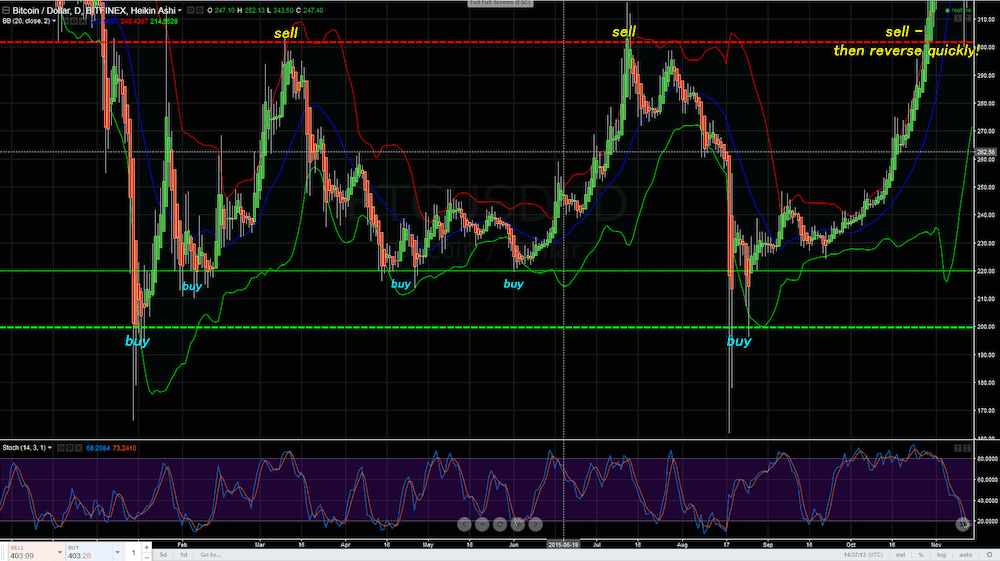
A daily chart of 2015’s ranging market, which eventually resolved to the upside.
Note the smaller swings within the greater swings, these too can be traded!
Also note that the indicator stays pegged in “overbought” territory during the strong upwards trend.
3) Trend Trading
As they say, “the trend is your friend, until it ends.” Trend traders aim to enter a prolonged up or down move and ride it out until its exhaustion. Unlike swing traders, trend traders often have no definite target in mind. This is especially true when price is reaching new highs, as Bitcoin did from early to late November 2013, when it went from $250 to over $1000 per coin.
Identifying a trend in the making is an art form, as trends formation is subtle in the early stages. One clear sign of an emerging trend is price consistently achieving higher highs and lower lows, or vice versa to the downside. Breaking through some previously significant level confirms the trend. Trends gain momentum as market participants “herd” into them. If the trend is particularly strong, it’s soon noticed by market outsiders and the financial media, which draws even more participants into the trend.
Price eventually goes parabolic and reaches a dramatic over-extension, at which point a violent reversal usually ensues. Good trend traders get in as early as possible and exit before the trend reverses. Trying to pick tops and bottoms is a fool’s errand however – it’s better to wait for confirmation of a trend from momentum-measuring indicators, such as the ROC (Rate Of Change) and MACD (Moving Average Convergence-Divergence), and to take profit sooner rather than later.
Although trends exist across all timeframes, when trading CFDs it’s best to look for significant moves over the longer timeframes; multiday, weekly or monthly. The Trailing Stop option is a great way to lock-in your profits from a trending market without having to guess at the exact moment of reversal. Like swing trading, trend trading fits very well with CFDs.
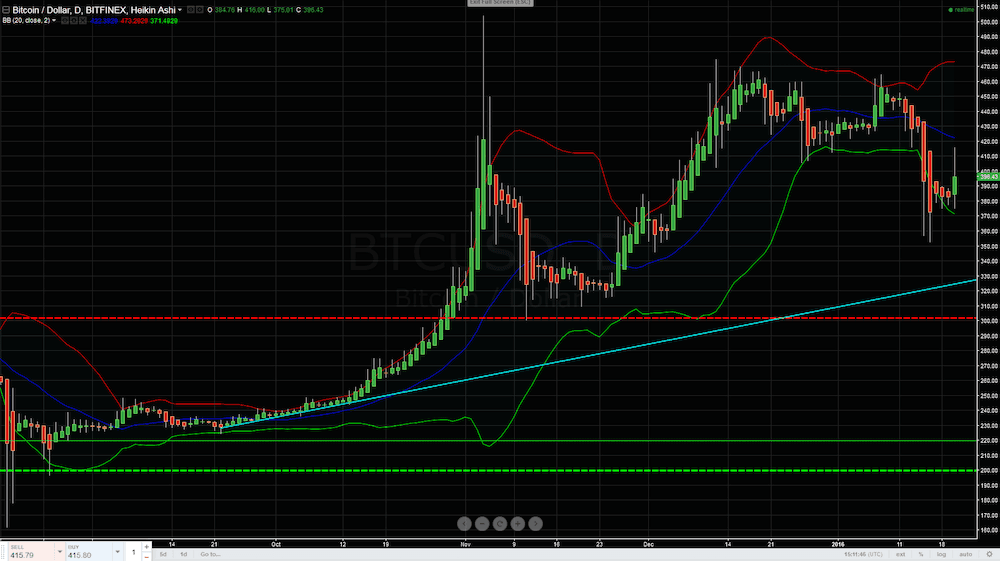
A daily chart for about 6 months, showing a new upwards trend.
Note that the trend builds up slowly, accelerates and then breaks through the $300 range.
4) Daytrading
Daytraders maintain a position only as long as they’re “on-duty” – typically 12 to 16 hours but sometimes longer. In Bitcoin trading chats, you’ll often see day traders bemoaning their lack of sleep as they nurse a particular trade they can’t bear to close out. Traders might trade intra-day swings and/or trends and some will engage in scalping (covered below).
Daytraders are likely to follow hourly or sub-hourly charts, with occasional reference to higher timeframes. This trading style is best-reserved for those who wish to make Bitcoin trading their full-time occupation. Daytrading aligns well with CFDs, except during times of low volatility when the price action is flat. During such “sideways” periods, even highly-leveraged CFDs are unlikely to compensate a daytrader for their time.
5) Scalping
Scalpers attempt to profit from minute-to-minute moves, often utilising imbalances in the order book to reap a multitude of minor profits. They tend to use charts of 5 minute duration or less. This method is entirely unsuited to CFDs due to the spread, which pushes trading fees above expected returns.
Part 5 – Understanding Markets
Charts reveal the past and present but traders make their money from correctly anticipating the future. Gauging the mood and momentum of the present correctly will aid prediction. Keeping in mind that history often repeats, or at least rhymes, helps even more.
Gauging the Mood
Although composed of rational individuals, markets as a whole often become irrational.
Market participants tend to cycle between the basic emotions of greed and fear. Everyone desires profit but fears loss. Successful traders are able to rise above excessive sentiment to judge markets with objectivity. Experienced swing traders, for example, sell when greed causes price to peak and buy when fear causes it to crash.
Mood is often revealed by a market’s reaction to news events. If a market continues to rise despite bad news, assume a bullish mood. Bearish markets shrug off good news. Disregard the emotional outbursts of other traders, at least until you have some idea of their skill level and reliability. If you find market chatter is unduly influencing your decisions, stop following it. Experienced trend traders profit from the herd’s behaviour without losing their wits to it.
Above all, beware the views of “experts.” Especially in regards to Bitcoin, public figures and the media often lack understanding and reason from bias. Our Bitcoin Obituaries page documents the pessimistic side of this phenomenon, although just as many examples could be cited of those who erred on the side of wild-eyed optimism.
Support or Resistance (S/R)
Remember, everyone is looking at the same price action and reaching for the same conclusion: where to next?
Previous highs and lows are the obvious answer – and you should look to see if they are being broken. Big round numbers also tend to continue a price momentum, for entirely psychological reasons (e.g. Bitcoin breaking the $400 barrier or going below $200).
When upwards price movements often pause or reverse at such levels, it is known as Resistance. Downwards moves behave similarly at levels known as Support. S/R levels represent key inflection points, so study how price behaves as it approaches them (remember to use helpful price alert features).
Setting your Close at loss (aka “stoploss”) to the other side of an important S/R level is sensible – if price slices through the level you know your trade was probably wrong so it’s best to exit. It’s often sensible to set your Close at profit (aka “target”) level slightly before an upcoming S/R level. If price continues through S/R, you can always re-open your trade.
Sometimes S/R lines are diagonal, as when price seems to follow or bounce off an invisible line when trending up or down. Seek out these so-called trendlines and mark them on your chart using the drawing tools. The more long-term they are and the more price respects them, the more significant they become when eventually breached.
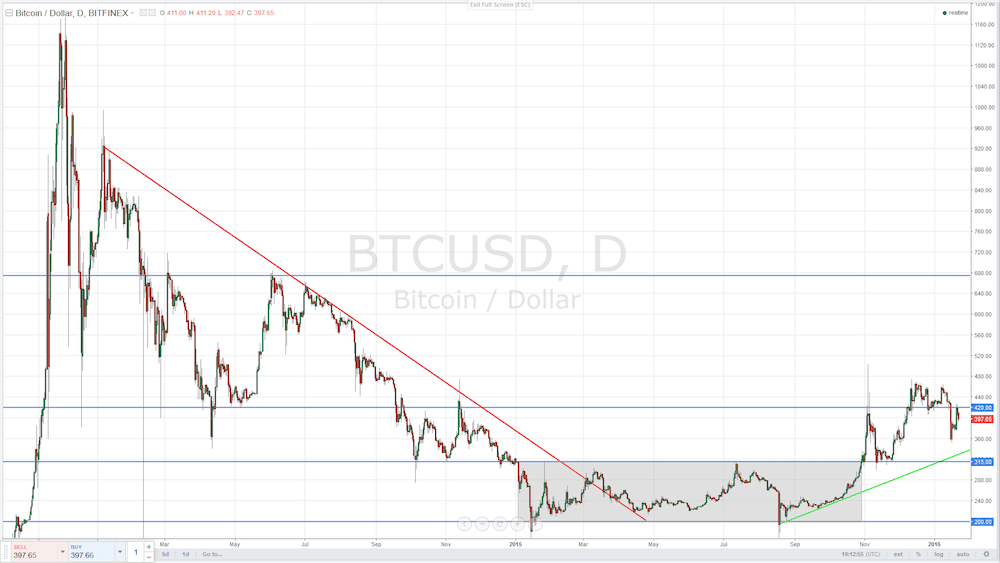
S/R lines are shown by blue horizontal lines – note that price often flattens or bounces at, or near, these levels.
The red diagonal trendline marks the approximate extent of the bear market, since the fall from the all-time highs. The grey box over most of 2015 marks the ranging market, when price consolidated and sentiment stabilised.
A tentative green trendline, as yet untested by any downwards correction, marks the beginning of a new uptrend.
One more factor to keep in mind is that a Resistance level, once breached to upside, often morphs into Resistance to the downside, and vice versa. So if the resistance level is $400 and the price just went above that, $400 will now become the new support level. The same principle often applies to trend lines.
Volume and the Order Book
Volume bars are commonly coloured according to their matching price candlestick. This doesn’t mean there are “more buyers than sellers” or vice versa – for every trade there’s always a buyer and seller. However, price moves in accordance with the side which is more aggressive in crossing the spread. This is to say, if buyers are generally paying sellers’ prices (which are almost always slightly above the current price) then price will rise. If the opposite occurs, price will fall. Sometimes the order book, which reveals the current buy and sell (aka bid or ask) prices and quantities, can be displayed on the chart:
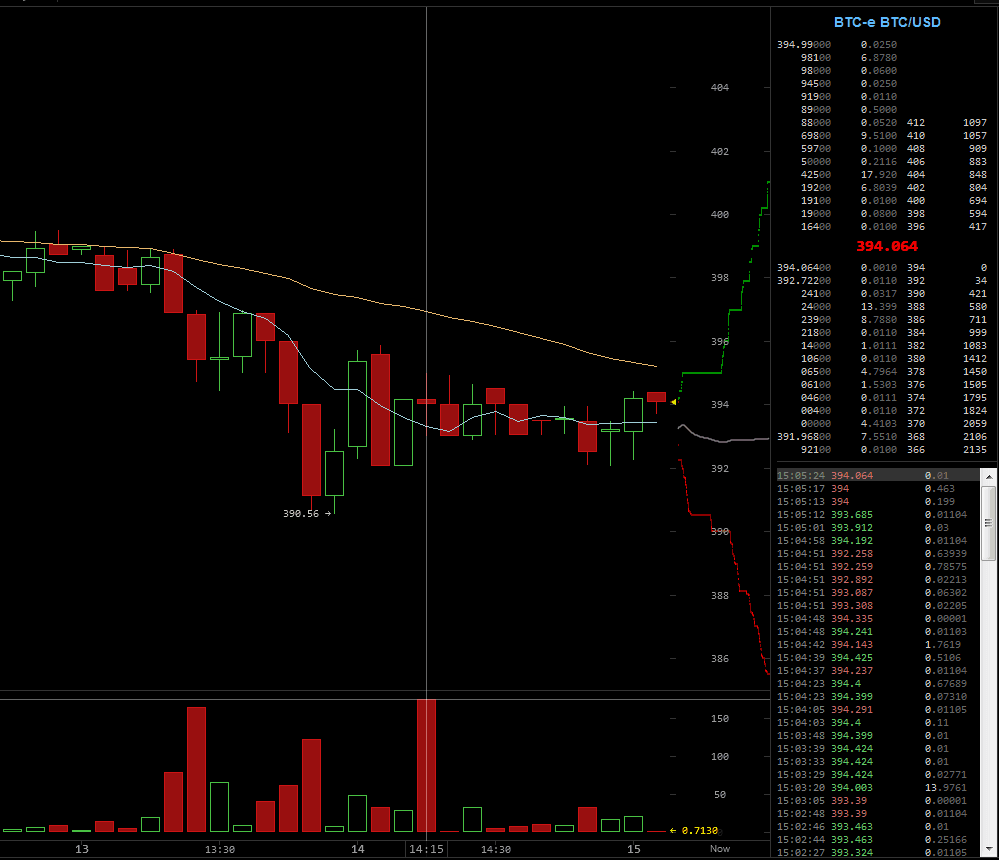
5 minute Bitcoin wisdom chart with the price (y-axis) and volume (x-axis) of offers displayed to the right of price. The same info is displayed in text in the top-right block; sell price offers and volume are listed above the spot price (394.064) and buy offers below it. The bottom right block displays the time, price and volume of recent trades.
Indicators
Although less universal than S/R levels, many traders monitor the same technical indicators for trading signals.Technical indicators look to predict the future price levels, or simply the general price direction, of a security by looking at past patterns.
Moving averages (MAs), which have the effect of smoothing out price volatility in proportion to their timeframe, are fairly standard. There are many strategies based on MAs and they’re a frequent component of other indicators.
Also popular are previously-mentioned indicators such as the MACD, Bollinger Bands, RSI and Stochastic Oscillator. Experiment with the variety of different indicators and make the effort to examine their formula so you know exactly what they measure and how. Remember that the purpose of indicators is to clarify, not to complicate. Price should always remain your primary indicator.
Patterns
Price often creates recognisable patterns as similar trading circumstances repeat over time. Common examples likely to be monitored by a majority of traders include the (reverse) Head and Shoulders, Bull or Bear Flags or Pennants, Triangles and various patterns indicating the formation of a top or bottom, from which price may be expected to reverse direction.
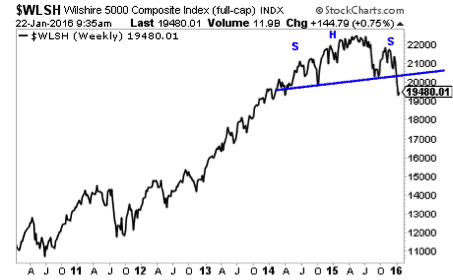
US stocks display a partially-complete Head and Shoulders topping pattern.
Being able to identify pattern formation and project price movement should the pattern complete successfully can certainly improve your trading. For all the information required to use patterns to predict price, consult Bulkowski’s Visual Index to Chart Patterns.
Combining Price, Timeframes, S/R, Volume, Indicators and Patterns
Although there are even more charting tools to discover, these six items could be considered the building blocks of a Bitcoin trading strategy. These elements become very powerful when used in combination. When several of them produce a buy or sell signal in unison, it’s known as confluence. The greater degree of confluence, the more confidence may be placed in a trade. However, the more factors you demand before executing a trade, the fewer potential trades will be available to you. Develop your trading plan accordingly; keeping in mind the amount of free time you’re willing to devote to analysing markets.
Part 6 – Managing Trading Risks
Predicting the market with perfect accuracy is impossible. Instead, you must devise a strategy which allows you to cope with whatever the market throws at you. This boils down to keeping your losses small while allowing profits to mount. Holding on to a losing trade while hoping for recovery is the absolute worst position to be in, financially and emotionally. Consider losses the cost of doing business and cut them quickly. A voluntary withdrawal lets you live to fight another day, a margin call can wreck you.
Always determine beforehand the price at which you’ll exit a non-performing trade. Enter this price at the same time you place your order, using the Close at loss feature. The Close at profit feature is also helpful if nervousness frequently compels you to take profits prematurely or if greed causes you to hang on too long, hoping for even more profit but ultimately losing out as price reverses. Always set a price target at which you’ll take at least a portion of your profits.
To be a risk worth taking, a trade should present a profit potential of at least twice its potential loss. If a pattern’s projected target or the next likely S/R level, etc. is a lot further from your entry price than your stop-loss, the trade becomes attractive. Ideally, your stop loss will be placed to the other side of significant S/R; if this level is breached it signals that price is moving against your expectations.
Exercise patience and wait for promising trading setups to materialise.
Trading Account Management
Even more important than knowing how to spot market opportunities and exploit them through low-risk/high-reward trades, is managing your trading capital. To begin, accumulate a sum of money you don’t mind losing. Sacrificing luxury expenditures over several months to build such a fund will do wonders for your mental discipline, as well as testing your resolve to face the risks of Real money trading.
When starting out, never risk more than 1% of your current trading capital on a single trade. Not only does this rule provide guidance on the minimum amount of trading capital required, it keeps you safe. Even if your stop-loss is triggered several times in a row, you’ll be left with plenty of dry powder. As you gain in experience, you may slowly increase this amount you risk up to a maximum of 5%, to be placed only on the highest-probability trades with the best risk-reward ratio.
Trading requires time, education and money
Even though this was a VERY extensive overview of Bitcoin trading it still won’t be enough for you to be completely successful at Bitcoin trading. Like I said in the past, there’s no such thing as easy money, and if you want to get good at Bitcoin trading you’ll probably suffer a few losses before starting to gain profits.
That’s why I highly recommend using the Demo mode of Plus500 before depositing actual money in your account. Also, I’ve linked to a lot of resources throughout this article of trading example, terminology and trading tools. Make sure to get familiar with them as them more information you have the better the trades you’ll execute.


hi everyone, how is it possible to trade bitcoin against the USD dollar on bittrex?
Hi there,
Currently there is no way to do this. Certain exchanges are crypto only. This means they never have to deal with the banking system and so have much lighter (or no) requirements for customer identity verification. Bittrex, Poloniex, Shapeshift and Changelly are all examples of crypto-only exchanges.
Certain crypto-only exchanges will allow you to trade Tethers… This is a crypto which is (theoretically) tied to the value of the USD. However, there are some concerns with Tethers. My advise would be to sign up to a reputable exchange which allows both fiat and crypto exchange, if that’s what you need.
Check out our 2017 exchange review guide for help on finding a good exchange:
https://99bitcoins.com/best-bitcoin-exchanges-comparison-review/
Thank you for this information.
Like my fellow Nigerian said ‘you are a blessing to humanity’.
God bless you.
Please how can I switch my VPN country
Hi Ezekiel,
Well, it depends on which VPN you’re using. When you connect to it, it should offer a list of countries for your selection. Without knowing which VPN you’re using, it’s hard to give any more specific instructions.
Hi Steven
thanks for the reply
I don’t use VPN currently, was asking to know.
Sir, If I want to use one which will you recommend
Hi Ezekiel, my pleasure.
Before looking at VPNs, you could check out the free and open source Tor Browser (at torproject.org). It’s a modified Firefox browser running on The Onion Routing protocol. Once Tor connects you to an entry node, your connection is then routed through a few other nodes before emerging from an exit node, which can be in any geographic location. This way, sites see your traffic as coming from the IP address of the exit node.
Of course, using a VPN with Tor is even better for privacy. I’m not an expert on VPNs but I see IPVanish and PrivateVPN both rated very highly. They both charge around $5.50 (US) per month, which seems reasonable to me.
Thanks
Make that three services that aren’t available. One explicitly says you can’t sign up from the US, one simply leaves the US off the list of countries you can sign up with, and one lets you try to register but just keeps saying over and over “Can’t connect to server, please try again” so you can’t actually sign up.
Ok, guess reading this whole page was just a waste of my time. Great.
Bitcoin CFD companies aren’t allowed to work inside the US due to the strict regulation imposed on them.
I feel like recommending a service that isn’t available to the US market might alienate a possibly sizeable number of your readers.
I know what you mean, however there’s a considerable amount of readers on this site that are outside the US and this couldn’t benefit them.
I appreciate all the lessons. You are a blessing to humanity most especially your students. Plus500,don’t accept trader from my country (Nigeria)!
Try using a VPN, Kazeem
Wow, good details. I went to Plus500, the site immediately says “Not available to users in the US”. Fortunately, I was accessing the internet through a US VPN so I simply had to switch my VPN country. But your readers may wish to have the big caveat that if they live in the US, Plus500 (at least) is not available.
You’re absolutely right and I completely forgot to mention that, will update the article. Thanks.