 5 Comments
Even those that don’t know what a bitcoin is or how it works, have probably heard about the massive price swings that take place in the digital currency. Bitcoins made global headlines in the Spring of 2013 when prices shot up from the teens to a high of $256, sending the value of all available currency well above $1 Billion.
The price of a bitcoin plummeted to below $100 after negative news that the founder of Silk Road, an anonymous marketplace for selling illegal goods, had been arrested. That decline was followed by renewed interest which was triggered by buying of bitcoins by Chinese speculators. The China driven rally took the price of bitcoin well above its Spring 2013 highs to all-time highs of over $1200 by the end of 2013.
Since then, prices have been trending lower following news that China’s central bank was applying measures to discourage buying bitcoins as well as the bankruptcy of MtGox, one of the largest bitcoin exchanges. After many ups and downs during 2014, we are close to ending the year with trading in a range between $300-$400.
So what drives the price of bitcoins?
Like any asset, the price of bitcoin is driven by supply and demand. More demand equals higher prices, while increased supply causes selling pressure. In the examples above, prices for bitcoins rose in Spring 2013 as demand for an anonymous currency increased following the Cyprus financial crisis which saw the government freeze and raid bank accounts of citizens and business in the country. Prices then dropped after worries that Silk Road’s closure would cause users of the marketplace to sell their bitcoins which they wouldn’t need anymore.
The same supply and demand effects fueled further rallies and declines in bitcoin prices as China became active in the market as well as MtGox’s bankruptcy causing a negative shadow on the industry. Overall, understanding supply and demand is important when analyzing the price of bitcoins. To do this, there are two main approaches; fundamental and technical.
Fundamental analysis
With fundamental analysis, traders monitor news and economic events that can lead to changes in supply and demand. A recent example was the increase of major firms accepting bitcoins such as Dell, Tiger Direct, and Wikipedia. This made it easier to spend bitcoins at these firms to purchase goods or make donations. However, these firms use payment processing companies that automatically convert all bitcoins into dollars. Therefore, each purchase increased the amount of bitcoins available for sale in the market. The increase in bitcoin spending at major firms has been attributed to leading to the decline in bitcoin prices from $650 to $300 from July to October.
Overall, when using fundamental analysis, traders search for macro changes which can effect existing supply and demand of bitcoins. Examples could be a government acting to allow or prohibit bitcoin trading, new products to increase consumer buying of bitcoins, or fraud in companies which would be expected to decrease interest of users of non-traditional money products.
Technical Analysis
Technical analysis is the most popular way traders analyze prices of assets. Unlike fundamental analysis which is useful for determining long term changes in supply and demand, technical analysis is better for short term moves. I like to use this analogy when describing technical analysis. Just like a thermometer is used to measure temperatures, technical analysis measures supply and demand.
Popular technical analysis examples are trend lines, support/resistance lines and Bollinger bands.
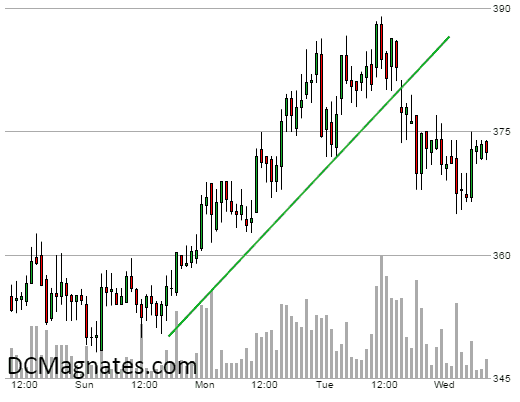
Trend lines: Trend lines on charts are used to view whether demand is rising or not. A rising trend reveals demand is consistently increasing while down trends show supply is rising. In the example below, prices rose from around $350 to $385 over two days. The rising trend line showed a consistent increase in demand for bitcoin. Traders can use such a trend and will keep buying until the trend is broken. Alternatively they can short bitcoins if the trend breaks which would signify short term demand has declined.
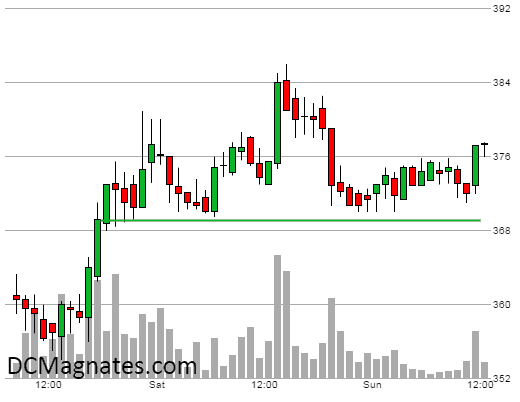
Support/Resistance: Support lines show areas of buying demand while resistance lines reveal areas of recent supply. In the example below, after prices of bitcoin rose above $370, they then dropped and bounced higher several times. The green line reveals that there was support at $370 where there was demand for bitcoins which kept prices from falling. Using this information a trader can buy near $370 as they look for rising demand to push prices higher. They would then sell if prices drop below $370 which would indicate that the short term demand has disappeared.
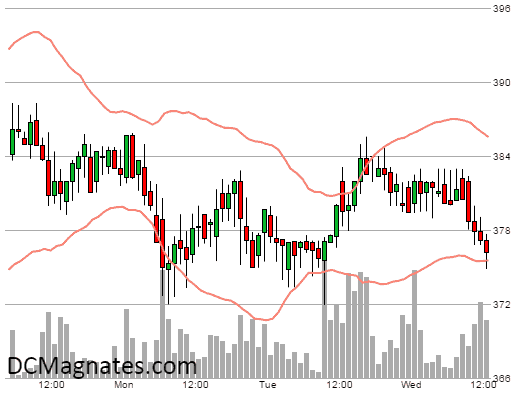
Bollinger bands: Name after its creator John Bollinger, Bollinger bands are one of the most popular technical indicators when analyzing prices of currencies. Bollinger bands (red lines) measure volatility in prices. When prices reach the lower band, it often means that prices are oversold and a bounce will take place soon. The opposite is true when prices reach the upper Bollinger bands. When trading with Bollinger Bands, it is best to combine them with another technical measure, such as only buying at the lower band when prices have support or are in an uptrend.
This article was prepared as guest post by DC Magnates where real time prices and technical analysis for bitcoin and other digital currencies is available for free on our chart pages.
If you want to find you how you can use the current decline in Bitcoin price to make a profit find out how to short sell Bitcoin in this next short article.


Very informative article! Thanks DC Magnates and Alexander!
Yeah, MtGox’s fall brought the price down and created a bad image for Bitcoins even if the actual currency had nothing to do with the bankruptcy. It’s a shame really and it shows us all that we shouldn’t place all our eggs in one basket and also make sure the basket isn’t frail.
I had no idea Bitcoin reached $1200 in 2013! What a drastic fall it took in 2014 to $300 – $900 in less than a year is just amazing! I think this shows that this currency is not even near to being stable yet.
I know about Bollinger bands from school but never really paid attention in class – guess I need to start learning about them to know how Bitcoin prices will move. Thanks for the explanations!
I’m just going to move over to PayCoin, I’m done with BitCoin. When it reaches a more stable price, I will consider using it.